1.2 Solutions
1.2.1 Exercise 3)
Calculate the square root of 1369 using the sqrt() function.
sqrt(1369)[1] 371.2.2 Exercise 4)
Square the number 13 using the ^ operator.
13^2[1] 1691.2.3 Exercise 5)
What is the result of summing all numbers from 1 to 100?
numbers_1_to_100 <- seq(1, 100, 1)
result <- sum(numbers_1_to_100)
result
[1] 5050The result 5050.
1.2.4 Exercise 6)
Use the names() function to display the variable names of the longley dataset.
names(longley)[1] "GNP.deflator" "GNP" "Unemployed" "Armed.Forces"
[5] "Population" "Year" "Employed" 1.2.5 Exercise 7)
Use square brackets to access the 4th column of the dataset.
longley[, 4] [1] 159.0 145.6 161.6 165.0 309.9 359.4 354.7 335.0 304.8 285.7 279.8
[12] 263.7 255.2 251.4 257.2 282.71.2.6 Exercise 8)
Use the dollar sign to access the 4th column of the dataset.
To solve this task we need to know the name of the fourth variable because using the dollar sign we can access variables in our dataset using their names. Recall, that names(longley) returns all variable names in our dataset. You can then count and select the name of the fourth variable or you can subset names(lognley) using square brackets like so: names(longley)[4].
names(longley)[4][1] "Armed.Forces"longley$Armed.Forces [1] 159.0 145.6 161.6 165.0 309.9 359.4 354.7 335.0 304.8 285.7 279.8
[12] 263.7 255.2 251.4 257.2 282.71.2.7 Exercise 9)
Access the two cells from row 4 and column 1 and row 6 and column 3.
longley[ 4, 1][1] 89.5longley[ 6, 3][1] 193.21.2.8 Exercise 10)
Using the longley data produce a line plot with GNP on the y-axis and population on the x-axis.
plot( GNP ~ Population, data = longley,
      bty = "n",
      pch = 16,
      main = "Relationship of GNP and Population Size")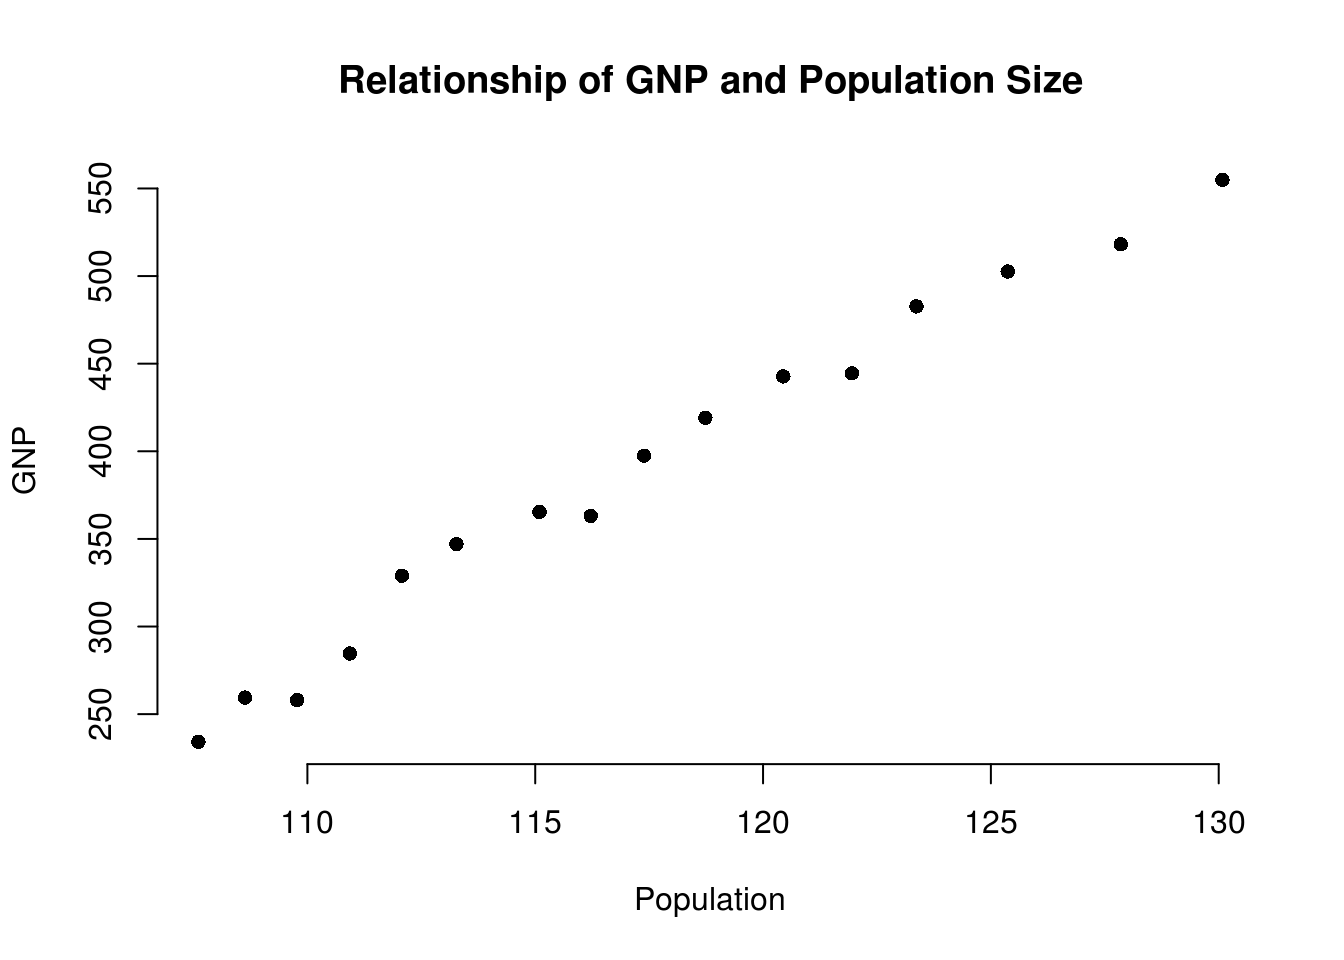
1.2.9 Exercise 11)
Use the help function ?plot to find out how to label the y-axis “wealth” and the x-axis “population”. The helpfiles tell us that the argument xlab lets us set a name for the x-axis and ylab for the y-axis.
plot( GNP ~ Population, data = longley,
      bty = "n",
      pch = 16,
      main = "Relationship of GNP and Population Size",
      xlab = "population",
      ylab = "wealth")