1 Measurement: What, Why and How
Topics: What is measurement? Why is measurement important? Representative versus pragmatic measurement. How are social measurements used and misused?
Required reading:
- Chapters 1 & 2, Pragmatic Social Measurement
Further reading:
- David J Hand. “Measurement: a very short introduction”. Oxford University Press 2016.
- Ethan Bueno de Mesquita, “The Aims of Public Policy Address: The Perils of Quantification”
1.1 Seminar
For this week’s class we are going to look at existing measures of the extent to which different countries in different years (1946-2008) were “democratic”. The data set that we are using was compiled for a project that created a synthetic measure of how democratic countries were by combining the information in all the different measures (Pemstein, Meserve, and Melton 2010). The different measures in the data set are all on different scales and were constructed by different authors according to different coding rules, covering different countries and years. This assignment is mostly aimed at reminding you how to do data analysis in R.
Remember that .Rdata files are loaded into R with the load() command. You can directly load the data file into R from the web with the following command:
- Before you look at the data set, consider whether you think of countries being democratic as a binary quantity or not. Is it the case that a country is either democratic or not, with no middle ground? Or is it a continuum, with countries varying widely in how democratic they are? Can a country be somewhat democratic?
There is no right answer to this question. Depending on your preferred definition of democracy, you may answer this question in different ways.
Only one of the measures we are going to look at, called pacl in the data set, is binary. The pacl measure is based on a “minimalist” definition of democracy. The authors of that measure write that “Our purpose is to classify political regimes observed in each country during each year either as democracies or as dictatorships, a term we use interchangeably with”authoritarian regimes” (Alvarez et al. 1996). Their definition is that democracies have popularly elected executives and legislatures with multiple parties, and pass a test regarding whether there is evidence that there has been a peaceful change in control of the government via elections. They make the case that a binary perspective is the right one:
The main difference between our approach and the alternatives is that we use a nominal classification, rather than a ratio scale. We believe that while some regimes are more democratic than others, unless offices are contested, they should not be considered democratic. The analogy with the proverbial pregnancy is thus that while democracy can be more or less advanced, one cannot be half-democratic: there is a natural zero point. Note that Bollen and Jackman (1989) are confused: it is one thing to argue that some democracies are more democratic than others and another to argue that democracy is a continuous feature over all regimes, that is, that one can distinguish the degree of “democracy” for any pair of regimes.
Bollen and Jackman (1989, 612) argue that difficulties in classifying some cases speak in favor of using continuous scales: “Dichotomizing democracy ….” in their view, “blurs distinctions between borderline cases.” Yet why are there “borderline cases”? Suppose we have defined democracy and not-democracy, established operational rules, and found that some cases cannot be unambiguously classified by these rules. Does this mean that “there are” borderline cases and that democracy is thus “inherently continuous”? And should we stick the cases which cannot be unambiguously classified, given our rules, into an “intermediate” category, half way between democracy and dictatorship? This view strikes us as ludicrous. If we cannot classify some cases given our rules, all this means is that either we have bad rules or we have insufficient information to apply them.
Note the key point they are making here is that while it may be difficult to classify some countries, that doesn’t necessarily mean the underlying concept is continuous. There are countries that are “more democratic” than others in the sense that they come closer to meeting all the requirements, but they are still not democracies according to the authors.
- Load the data file “week-1-democracy.Rdata” into R. The first three variables in the data frame “democracy” are:
cowcode: COW country codes according to the Correlates of War Projectcountry: country nameyear: calendar yearIf you look at the top of the data file using
head(democracy)you will see 12 further variables (in alphabetic order fromarattovanhanen). Each of these corresponds to a different measure of democracy. You might recognise some of the names (egfreedomhouseandpolityare relatively well-known and widely used). The coverage of country-years varies by measure.For each of the 12 measures, use the data set to calculate the range of scores used for that measure.
##      arat blm bollen freedomhouse hadenius mainwaring munck pacl polity
## [1,]   29   0      0            1        0         -1     0    0    -10
## [2,]  109   1    100            7       10          1     1    1     10
##      polyarchy prc vanhanen
## [1,]         0   1        0
## [2,]        10   4       49
- In addition to the range of scores, we might want to know if the distribution of scores look similar for the different measures. Generate histograms of all the scores for each measure. Do they look generally similar or not?
# # Base-R Plot
# par(mfrow=c(3,4)) # create a 3 x 4 plot layout grid
#
# for (i in 4:15) hist(democracy[,i],
#                      main=names(democracy)[i],
#                      xlab="Democracy Score")
#
# par(mfrow=c(1,1)) # return to a single plot layout

# GGPLOT version
library(ggplot2)
library(ggpubr)
library(ggthemes)

p <- list() # empty plotlist

for (i in 4:15){
  d <- data.frame("x"=democracy[,i],"n"=names(democracy)[i])

  p[[i-3]]<- ggplot(d,aes(x=x)) +
    facet_wrap(~ n) +
    geom_histogram(col="black",fill="lightgray") +
    labs(x="Democracy Score") +
    theme_calc()
}

ggarrange(plotlist=p,nrow = 3, ncol = 4)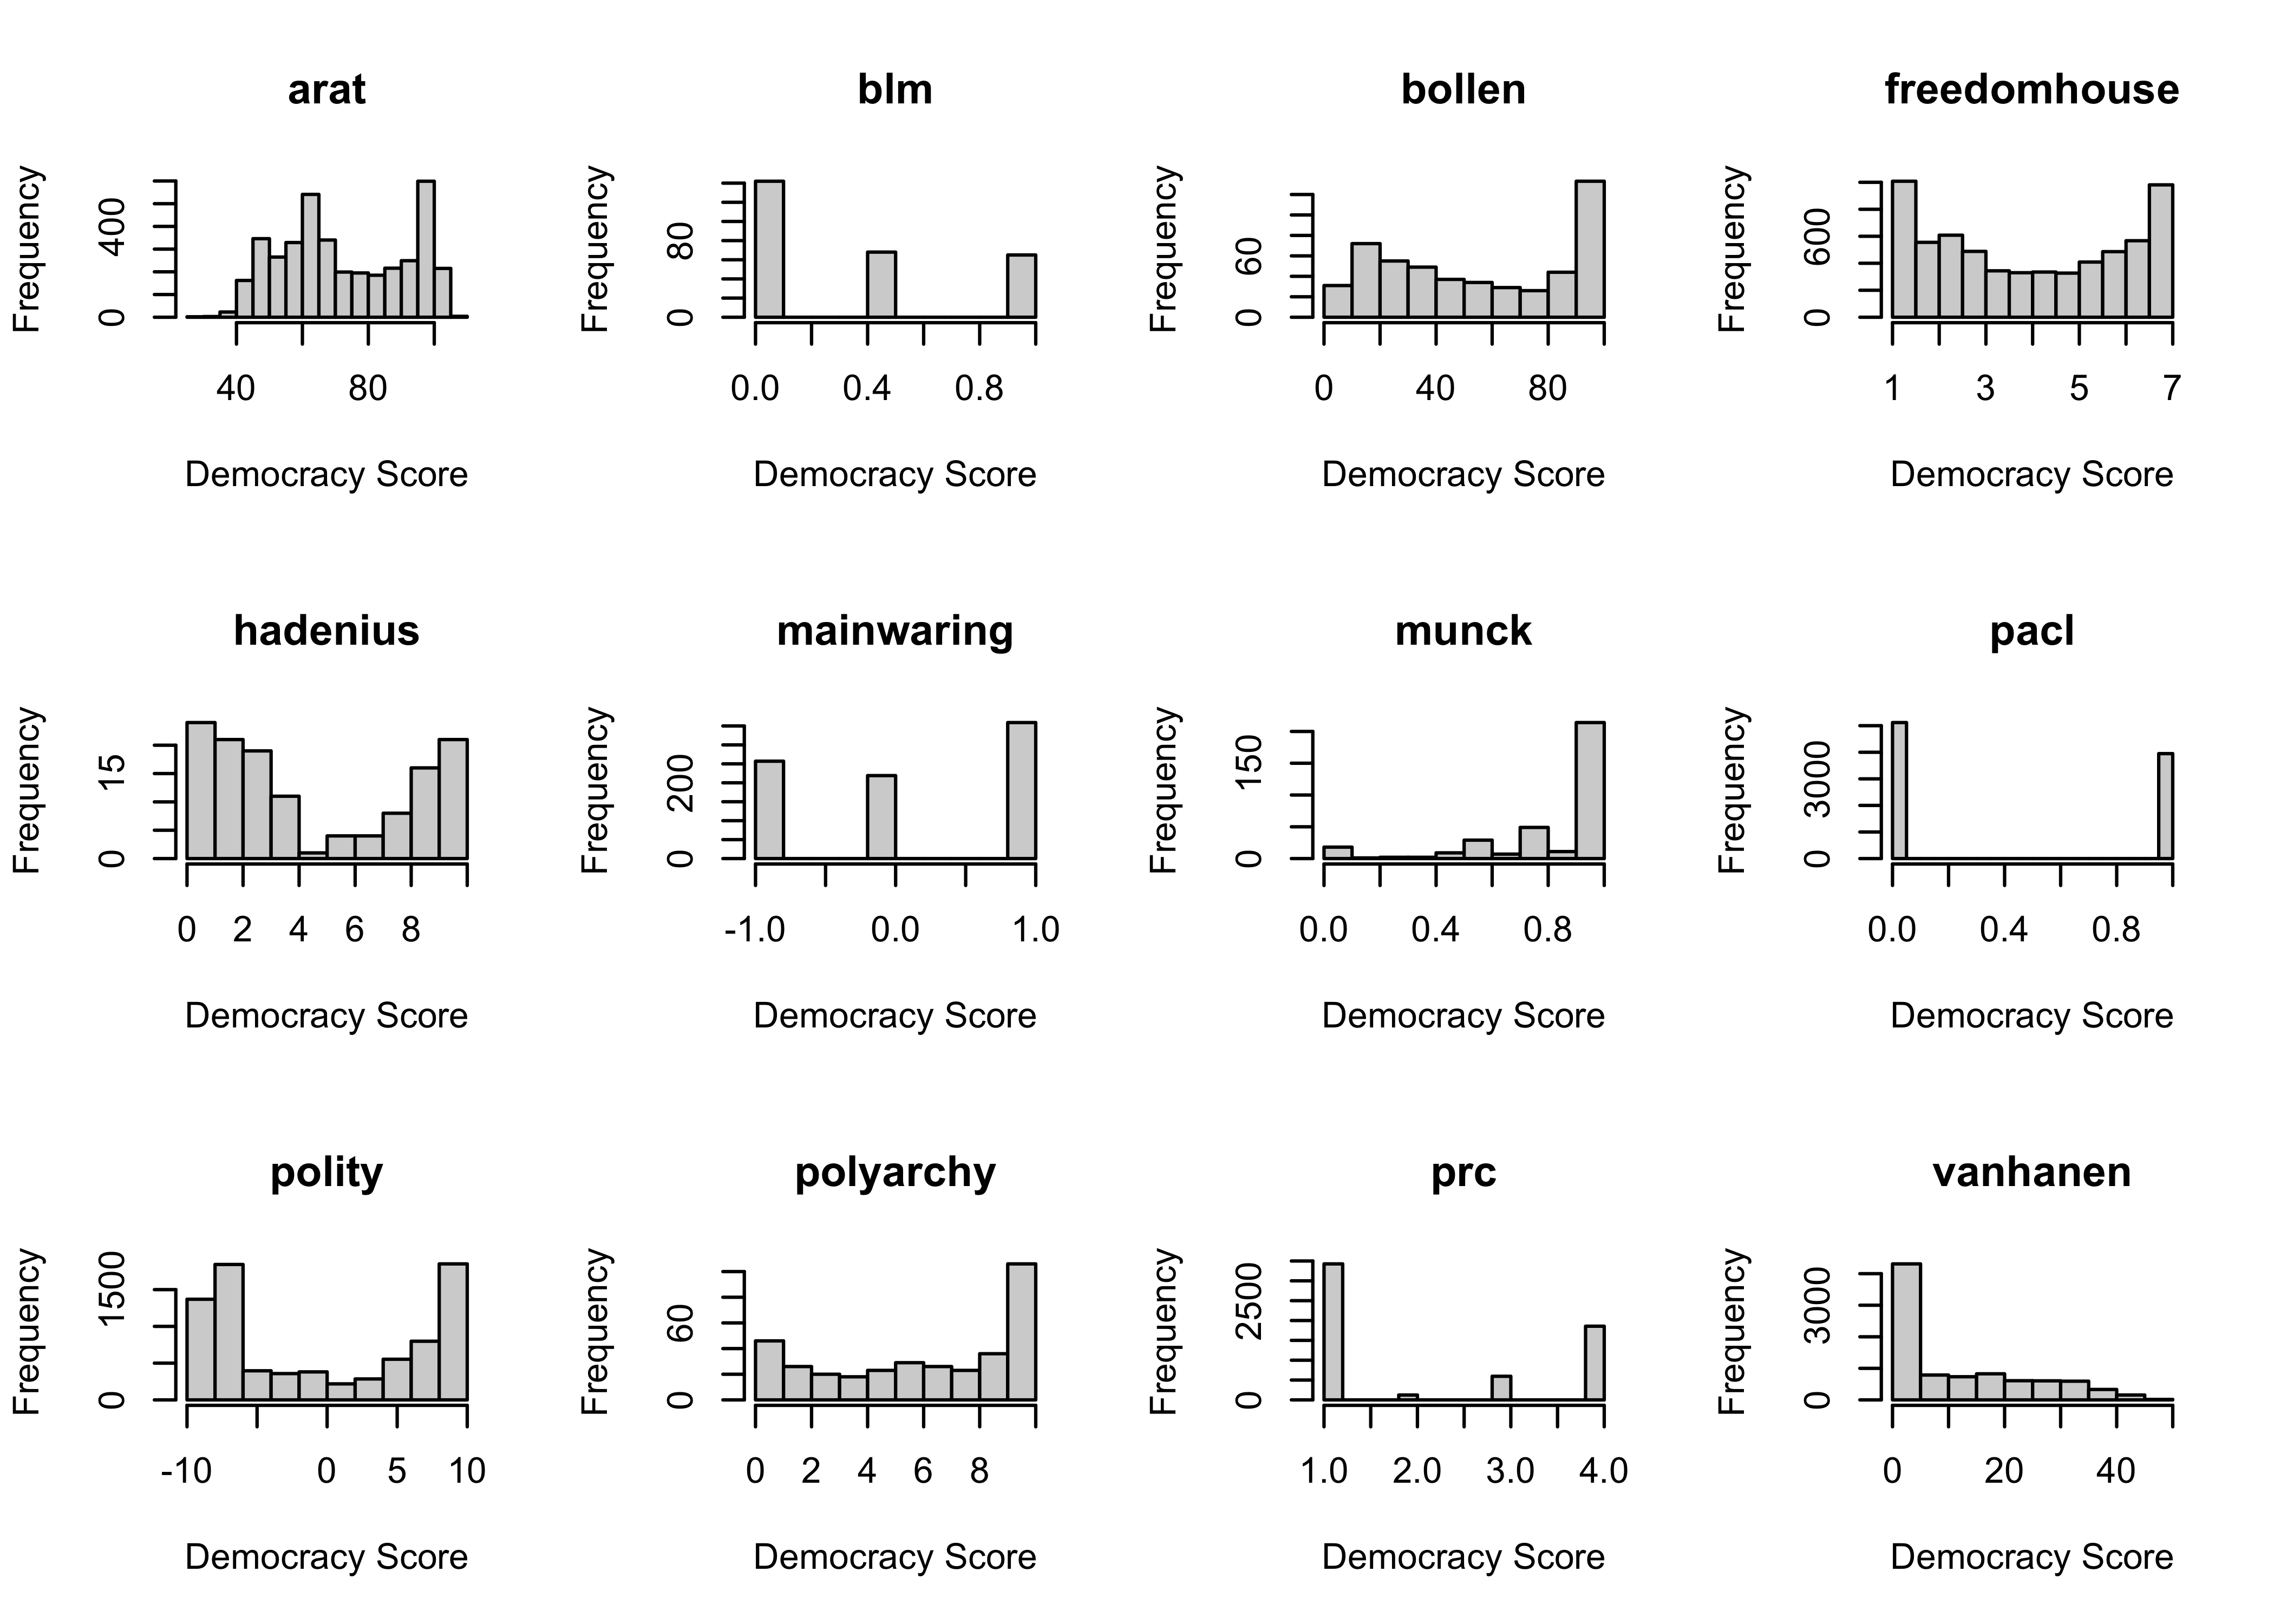
- The
polityscore has integer values from -10 to 10. Calculate the proportion of country-years that are classified as democratic bypacl, among country-years with each value of thepolityscore.
# There are several ways to do this. Here are two:

# with prop table
prop.table(table(democracy$polity,democracy$pacl),1)
##
## 0 1
## -10 1.000000000 0.000000000
## -9 0.988522238 0.011477762
## -8 0.997134670 0.002865330
## -7 1.000000000 0.000000000
## -6 0.990024938 0.009975062
## -5 0.912844037 0.087155963
## -4 0.988700565 0.011299435
## -3 0.875675676 0.124324324
## -2 0.956250000 0.043750000
## -1 0.824858757 0.175141243
## 0 0.911764706 0.088235294
## 1 0.904761905 0.095238095
## 2 0.409090909 0.590909091
## 3 0.542168675 0.457831325
## 4 0.537313433 0.462686567
## 5 0.244725738 0.755274262
## 6 0.319620253 0.680379747
## 7 0.205882353 0.794117647
## 8 0.122199593 0.877800407
## 9 0.097625330 0.902374670
## 10 0.015646259 0.984353741
- Plot the results of Q4 by
polityscore. Describe the association you see between the two scores.
pacl_prop_by_polity <- prop.table(table(democracy$polity,democracy$pacl),1)[,2]

# # Base R Version
# plot(names(pacl_prop_by_polity),pacl_prop_by_polity,
#      xlab="Polity Score",ylab="Proportion pacl Coded as Democratic")

# ggplot
plotdata <- as.data.frame(pacl_prop_by_polity)
plotdata$polity <- as.numeric(rownames(plotdata))
ggplot(plotdata,aes(x=polity, y= pacl_prop_by_polity)) +
  geom_point() +
  labs(x ="Polity Score", y="Proportion pacl Coded as Democratic") +
  theme_calc()
Plot shows that as there is a positive relationship between polity IV score and pacl classification, as for higher polity IV values (indicating more democracy), the proportion of country-years classified as a democracy increases. We see that there is more ‘agreement’ between the two measures at the edges of the polity IV scale, where its easier to make clear distinctions, and less agreement in the middle of the polity IV scale. A positive relationship is to be expected between two measures of the same/similar concept, democracy.
- Which are the country-years that are classified as a 10 by
polityand 0 (non-democratic) bypacl? Take the last of these in the data set, and figure out whether thepolityor thepaclscore changed in the subsequent year. What happened in that country in that year? Hint: There are many ways to achieve this. And it’s always a good idea to get inspiration from the internet.
##  [1] "Costa Rica 1948"     "Czechoslovakia 1946" "Cyprus 1974"
##  [4] "Cyprus 1975"         "Cyprus 1976"         "Cyprus 1977"
##  [7] "Cyprus 1978"         "Cyprus 1979"         "Cyprus 1980"
## [10] "Cyprus 1981"         "Cyprus 1982"         "Malaysia 1957"
## [13] "Malaysia 1958"       "Malaysia 1959"       "Malaysia 1960"
## [16] "Malaysia 1961"       "Malaysia 1962"       "Malaysia 1963"
## [19] "Malaysia 1964"       "Malaysia 1965"       "Malaysia 1966"
## [22] "Malaysia 1967" "Malaysia 1968"## cowcode country year arat blm bollen freedomhouse hadenius mainwaring
## 8401 820 Malaysia 1969 75 NA NA NA NA NA
## munck pacl polity polyarchy prc vanhanen
## 8401 NA 0 1 NA 1 12.4Clearly something happened in Malaysia in 1969 to explain the drop in polity IV score. Indeed, the 13th May 1969 saw the outbreak of race riots which eventually led to the suspension of parliament and the government seizing emergency powers.
- Plot the trajectory of the
polityscores and thepaclscores for the country in question across the full set of years in the data set.
tmp <- subset(democracy,country == "Malaysia")

# # Base R
# par(mfrow=c(1,2))
# plot(tmp$year,tmp$polity,ylim=c(-10,10),xlab="Year",ylab="polity")
# plot(tmp$year,tmp$pacl,ylim=c(0,1),xlab="Year",ylab="pacl")
# par(mfrow=c(1,1))


# ggplot
ggplot(tmp, aes(x= year, y = polity)) +
  geom_line(color = "red") +
  theme_clean() + ylim(c(-10,10)) +
  labs(title = "Measured Levels of Democracy in Malaysia", x ="Year", y="Polity IV") +
  theme(plot.background = element_rect(color=NA))
- Use the command
cor(democracy[,4:15],use = "pairwise.complete.obs")to calculate the correlation table for the 12 measures. You may want to wrap that in around(x,2)command to make it easier to read. Note that theuse =argument is needed because not all the measures are available in all the country-years, so we just calculate correlations between measures for the country-years where both are available. What does a higher correlation mean in this context? What does a low correlation mean in this context?
##              arat  blm bollen freedomhouse hadenius mainwaring munck pacl
## arat         1.00 0.60   0.91         0.85       NA       0.67  0.79 0.81
## blm          0.60 1.00   0.74         0.69     0.65       0.88  0.75 0.69
## bollen       0.91 0.74   1.00         0.94       NA       0.74  0.66 0.82
## freedomhouse 0.85 0.69   0.94         1.00     0.95       0.81  0.63 0.83
## hadenius       NA 0.65     NA         0.95     1.00       0.91    NA 0.83
## mainwaring   0.67 0.88   0.74         0.81     0.91       1.00  0.69 0.74
## munck        0.79 0.75   0.66         0.63       NA       0.69  1.00 0.58
## pacl         0.81 0.69   0.82         0.83     0.83       0.74  0.58 1.00
## polity       0.84 0.82   0.87         0.90     0.90       0.84  0.77 0.84
## polyarchy      NA 0.74     NA         0.91       NA       0.72  0.76 0.79
## prc          0.81 0.89   0.83         0.87     0.87       0.80  0.71 0.84
## vanhanen     0.82 0.76   0.82         0.82     0.82       0.72  0.61 0.78
##              polity polyarchy  prc vanhanen
## arat           0.84        NA 0.81     0.82
## blm            0.82      0.74 0.89     0.76
## bollen         0.87        NA 0.83     0.82
## freedomhouse   0.90      0.91 0.87     0.82
## hadenius       0.90        NA 0.87     0.82
## mainwaring     0.84      0.72 0.80     0.72
## munck          0.77      0.76 0.71     0.61
## pacl           0.84      0.79 0.84     0.78
## polity         1.00      0.89 0.89     0.83
## polyarchy      0.89      1.00 0.88     0.78
## prc            0.89      0.88 1.00     0.81
## vanhanen       0.83      0.78 0.81     1.00
Higher correlations mean that, in the country-years that both measures cover, higher scores in one measure more strongly predict higher scores in the other. Such measures are “more similar” in their assessment of the relative democratic-ness of country-years. Lower correlations mean that those measures have greater disagreement regarding the relative democratic-ness of country-years. Note the key word “relative” in the previous statements: correlations do not care about absolute levels, and all of these measures are on different scales anyway.
The highest correlation (0.95) in the table is between freedomhouse and hadenius; the lowest (0.58) is between pacl and munck.
- Overall, do these seem like big disagreements between measures or small disagreements between measures? Are you surprised at how much different measures agree or at how much they disagree?
There is no right or wrong answer here. In a way, it is reassuring that all these measures that seek to capture related concepts are correlated. Yet, they don’t always ‘agree’, or don’t ‘agree’ to the same extent. This may be because of features of their measurement level (scales vs classifications), it could be because they intended to measure slightly different things or it could be that some are more prone to measurement error than others. However, we cannot really say which one is more ‘correct’, as the whole point of all of these measures is to measure something that is not directly observable. Instead, we can ask ourselves, following a pragmatic approach, which one is most useful (given a particular research purpose) to say something meaningful about the world.
1.2 Quiz
- What is measurement inference?
- Inference from observed data about the data we would have observed for the same units given counterfactual circumstances
- Inference from observed data to unmeasured (latent) quantities describing the same units
- Inference from observed data to the data we would have measured if we had access to a broader population of units
- Inference from observed data about the correlations in the observed data
- Which of the following types of measurement scales does not allow for conveying ordering?
- Nominal Scales
- Ordinal Scales
- Interval Scales
- Ratio Scales
- Which of the following is true about pragmatic social measurement?
- It is the view that, when developing a measure, we are representing something that exists in the world and which causally shapes interactions
- It only includes unsupervised measurement techniques, not supervised ones
- It is the view that, when developing a measure, we are creating a summary of things we observe in the world, inventing a concept to help us talk about patterns that we observe
- It specifies a particular causal relationship between target concept \(\mu\) and measure \(m\)
- What kind of peril of (social) measurement lies in the following example? “Funding is attributed to schools based on their pupils’ results in standardised testing, therefore schools start adapting their curriculum to maximise test scores.”
- A problem of fairness
- A problem of malign intentions
- A problem of narrowness
- A problem of unintended consequences
- What kind of personality profile to I have, according to 16 personalities?
- I’m a Commander (ENTJ - Extraverted, Intuitive, Thinking, and Judging)
- I’m a Virtuoso (ISTP -Introverted, Observant, Thinking, and Prospecting)
- I’m an Advocate (INFP - Introverted, Intuitive, Feeling, and Prospecting)
- I’m an Executive (ESTJ - Extraverted, Observant, Thinking, and Judging)
- I can be whatever I want, I don’t care what some silly internet test says