6 Supervised Scale Measurement III: Linear Indices
Topics: Strategies for scale development without training data. Developing weights using qualitative expertise.
Required reading:
- Chapter 9, Pragmatic Social Measurement
Further reading:
Theory
- Gerardo Munck and Jay Verkuilen. “Conceptualizing and Measuring Democracy: Evaluating Alternative Indices” Comparative Political Studies 2002.
- Krista Loose, Yue Hou and Adam Berinsky. “Achieving Efficiency Without Losing Accuracy: Strategies for Scale Reduction with an Application to Risk Attitudes and Racial Resentment”
Country-Level Indices
- Fragile States Index (Fund for Peace)
- Global Liveability Index (The Economist Intelligence Unit)
- Human Capital Index (World Bank)
- World Press Freedom Index (Reporters without Borders)
- Global Gender Gap Index (World Economic Forum)
- Euro Health Consumer Index (Health Consumer Powerhouse Ltd)
- Democracy Index (The Economist Intelligence Unit)
- Freedom House Indices (Freedom House)
- Polity Scores (Polity Project)
- Global Terrorism Index (Institute for Economics and Peace)
- Global Peace Index (Institute for Economics and Peace)
- Global Health Security Index (Nuclear Threat Initiative, Johns Hopkins Center for Health Security & the Economist Intelligence Unit)
- Corruption Perception Index (Transparency International)
- Index of Economic Freedom (Heritage Foundation)
- Index of Nature Connectedness
Sub-National Area-Level Indices
Individual-Level Indices
6.1 Seminar
In this class, we are going to do some analysis comparing the World Bank’s Human Capital Index to the UN’s Human Development Index. Both of these are measured at the country level. These are so obviously similar concepts, that the World Bank has a FAQ specifically addressing what is different about the Human Capital Index from the previously existing Human Development Index:
10. How does the Human Capital Index differ from UNDP’s Human Development Index?
“UNDP’s pioneering Human Development Index is a summary measure of average achievement along key dimensions of human development—a long and healthy life, being knowledgeable, and having a decent standard of living.
While both indices spotlight human capabilities as central to national development, the Human Capital Index also strengthens the economic case for investing in people. The two are highly complementary but differ in the way they are formulated.
The Human Capital Index links selected human capital outcomes with productivity and income levels. It is a forward-looking measure of how current health and education outcomes (including a new measure of learning-adjusted years of school) will shape productivity for the next generation of workers.”
The concept of development was defined by the authors of the Human Development Index as “a process of enlarging people’s choices”, so we can see that there is some conceptual distinction between the conceptualisation of HDI (human development facilitates individual human choices) and the conceptualisation of HCI (human capital facilitates economic productivity).
As discussed in the textbook, the Human Development Index is constructed as follows. HDI incorporates three sub-indices, a Life Expectancy Index \(I_{LE}\), an Education Index \(I_{E}\), and a Income Index \(I_{I}\). These sub-indices are defined in very minimalist ways, with just one or two indicators each (four overall). Each is defined such that the minimum score attainable is 0 and the maximum is 1. \(LE\) is life expectancy at birth. Mean years of schooling \(MYS\) is among those aged 25 and older while expected years of schooling \(EYS\) is a projection for those currently under 18. \(GNIpc\) is per capita gross national income in purchasing power parity US dollars:
\[I_{LE} = \frac{LE - 20}{85 - 20}\] \[I_{E} = \frac{1}{2} \cdot \frac{MYS}{15} + \frac{1}{2} \cdot \frac{EYS}{18}\] \[I_{I} = \frac{\log(GNIpc) - \log(100)}{\log(75000) - \log(100)}\]
As noted in the textbook, the benchmarks for what qualifies as full and what qualifies as zero on each of these sub-indices are quite important. These rescalings are designed to place all countries in the interval \(\left[0,1\right]\) and in the few cases where the rescaled values exceed that range, they are censored to the relevant extreme (this only occurs for the top end of the education and income indices). HDI then aggregates these three fractions:
\[HDI^3 = I_{LE} \cdot I_E \cdot I_I\]
This is a multiplicative aggregation: development is understood to arise out of jointly possessing life expectancy, education and income. These are complementary resources which do not substitute for one another.
One potential criticism of HDI is that there is not really a clear justification for why going from, for example, 68.75 to 85 years of life expectancy (\(I_{LE} = 0.75\) to \(I_{LE} = 1.00\)) is as consequential in terms of development as going from a GNI of $14331 to a GNI of $75000 (\(I_{I} = 0.75\) to \(I_{I} = 1.00\)). The Human Capital Index authors make a serious effort to justify these connections between marginal changes in their indices and marginal changes in productivity. They do not have direct measures of country-level productivity, so they cannot use the supervised strategy that we considered in our previous class, but they nonetheless are able to go beyond an equal weighting strategy in justifying how each indicator maps into the index. For full detail, see (World Bank 2018, p34–38).
The components of the HCI are combined into a single index by first converting them into contributions to productivity. Multiplying these contributions to productivity gives the overall HCI. The HCI summarizes how productive children born today will be as members of the future workforce, given the risks to education and health summarized in the components. The HCI is measured in units of productivity relative to a benchmark corresponding to complete education and full health.
In the case of survival, the relative productivity interpretation is stark: children who do not survive childhood never become productive adults. As a result, expected productivity as a future worker of a child born today is reduced by a factor equal to the survival rate, relative to the benchmark where all children survive.
In the case of education, the relative productivity interpretation is anchored in the large empirical literature measuring the returns to education at the individual level. A rough consensus from this literature is that an additional year of school raises earnings by about 8 percent. This evidence can be used to convert differences in learning-adjusted years of school across countries into differences in worker productivity. For example, compared with a benchmark where all children obtain a full 14 years of school by age 18, a child who obtains only 9 years of education can expect to be 40 percent less productive as an adult (a gap of 5 years of education, multiplied by 8 percent per year).
In the case of health, the relative productivity interpretation is based on the empirical literature measuring the economic returns to better health at the individual level. The key challenge in this literature is that there is no unique directly measured summary indicator of the various aspects of health that matter for productivity. This microeconometric literature often uses proxy indicators for health, such as adult height. This is because adult height can be measured directly and reflects the accumulation of shocks to health through childhood and adolescence. A rough consensus drawn from this literature is that an improvement in health associated with a 1-centimeter increase in adult height raises productivity by 3.4 percent.
HCI thus has three sub-indices (like HDI), which are survival \(I_{V}\), school \(I_S\), and health \(I_H\), which are aggregated multiplicatively: \[HCI = I_{V} \cdot I_{S} \cdot I_H\] Note the slight difference that \(HDI^3 = I_{LE} \cdot I_E \cdot I_I\) whereas \(HCI = I_{V} \cdot I_{S} \cdot I_H\), the former means that HDI is the cube root of the product of the indicators whereas HCI is just the product of the indicators, we will look at the consequences of this in the exercise below. The sub-indices are functions of the indicators that are motivated by the quoted discussion above:
\[I_{V} = \frac{1 - \text{under-5 mortality rate}}{1}\] \[I_{S} = e^{ \psi (\text{expected years of school} \cdot \frac{\text{harmonized test score}}{625} - 14)}\] \[I_H = e^{ \frac{\gamma_\text{ASR} \cdot (\text{adult survival rate} - 1) + \gamma_\text{stunting} \cdot (\text{not stunted rate} - 1)}{2}}\]
The components of the index are expressed here as contributions to productivity relative to the benchmark of complete high-quality education and full health. The parameter \(\psi = 0.08\) measures the returns to an additional year of school. The parameters \(\gamma_{ASR} = 0.65\) and \(\gamma_{\text{stunting}} = 0.35\) measure the improvements in productivity associated with an improvement in health, using adult survival and stunting as proxies for health. The benchmark of complete high-quality education corresponds to 14 years of school and a harmonized test score of 625. The benchmark of full health corresponds to 100 percent child and adult survival and a stunting rate of 0 percent.
- Create a subset of the data that only includes the six sub-indices of HDI and HCI, as defined above: \(I_L\), \(I_E\) and \(I_I\) for HDI, \(I_V\), \(I_S\), and \(I_H\) for HCI. Plot and calculate the pairwise correlations between all six of these sub-indices. Which are the strongest and the weakest pairwise correlations? Why do these patterns make sense? Code Hint:* You can use the
pairs()command to create a base-R plot, orggpairs()from theGGallypackage like last week.
library(GGally)
library(kableExtra)

# subset the data
sub_indices <- hcihdi[,c("I_L","I_E","I_I","I_V","I_S","I_H")]

# table with pairwise correlations
kable(round(cor(sub_indices),3),booktabs=T) %>% kable_styling(full_width = F)| I_L | I_E | I_I | I_V | I_S | I_H | |
|---|---|---|---|---|---|---|
| I_L | 1.000 | 0.841 | 0.850 | 0.928 | 0.842 | 0.927 |
| I_E | 0.841 | 1.000 | 0.876 | 0.851 | 0.912 | 0.771 |
| I_I | 0.850 | 0.876 | 1.000 | 0.814 | 0.842 | 0.805 |
| I_V | 0.928 | 0.851 | 0.814 | 1.000 | 0.805 | 0.850 |
| I_S | 0.842 | 0.912 | 0.842 | 0.805 | 1.000 | 0.740 |
| I_H | 0.927 | 0.771 | 0.805 | 0.850 | 0.740 | 1.000 |
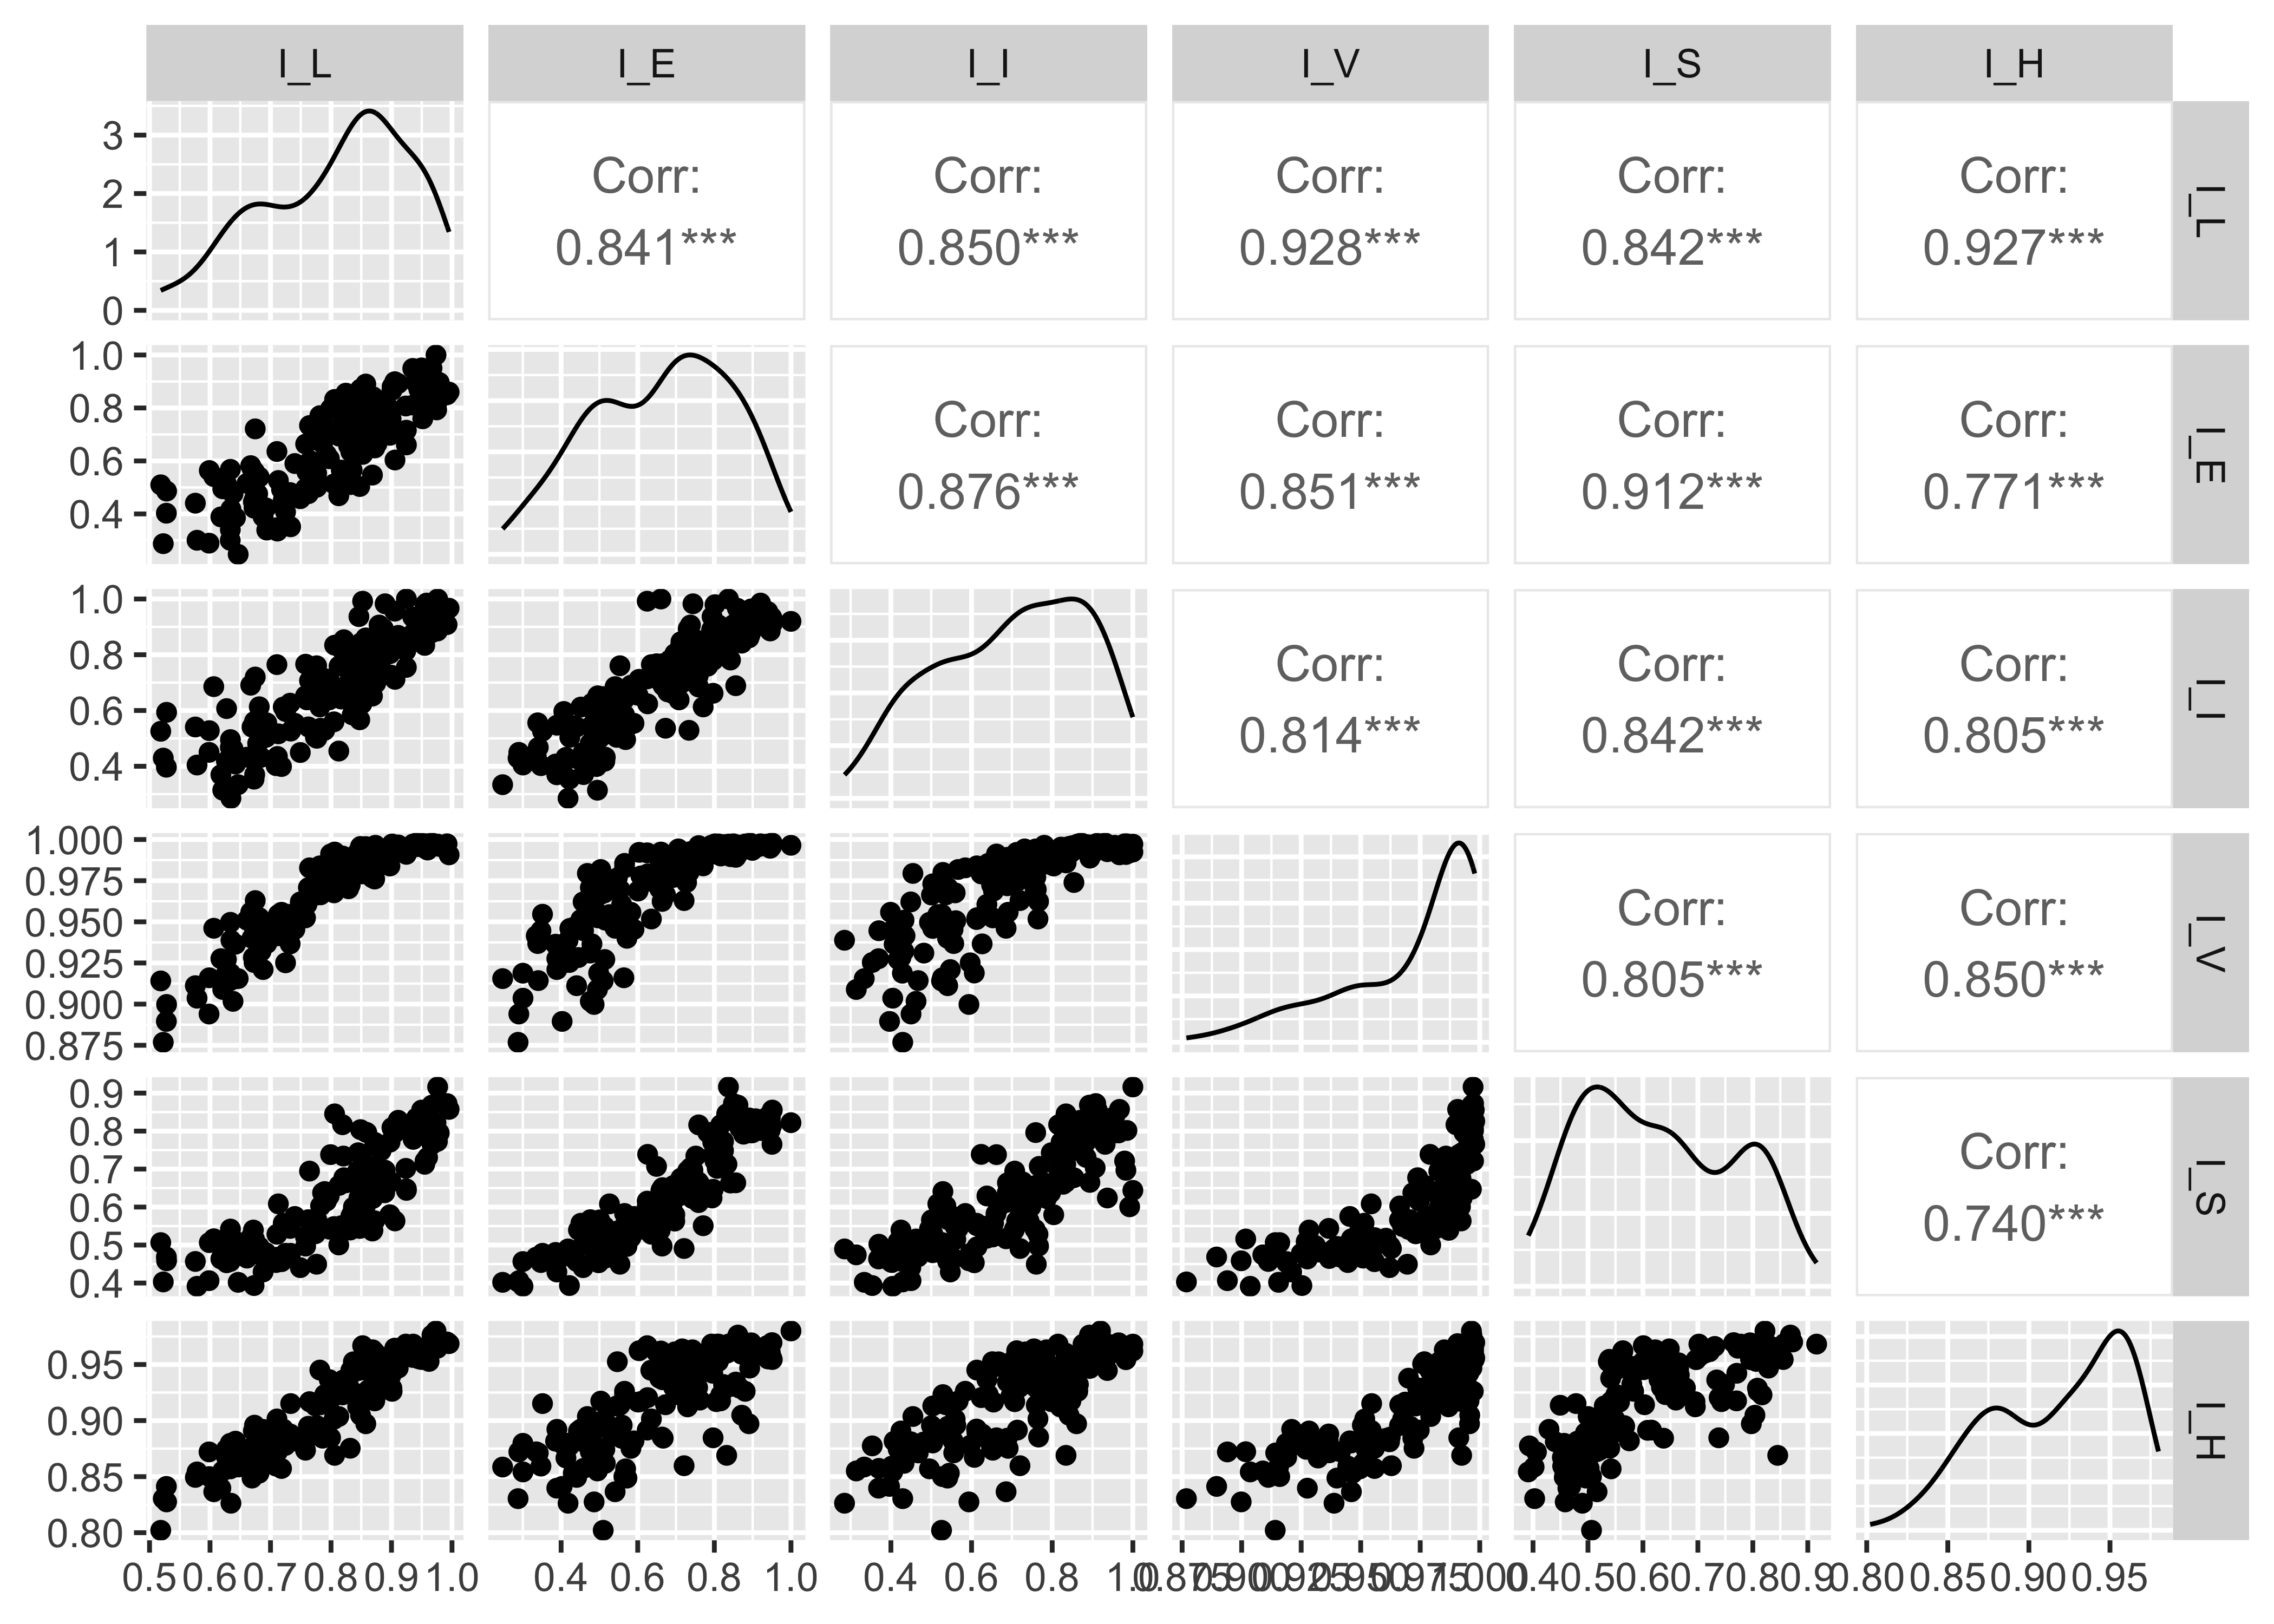 The strongest pairwise correlations are between the HDI life expectancy index \(I_L\) and the HCI survival index \(I_V\) and HCI health index \(I_H\). This makes sense, because life expectancy (\(I_L\)) depends both on childhood survival (which is what \(I_V\) measures) and also on adult survival and health (which is what \(I_H\) measures).
The weakest pairwise correlation is between the HCI schooling measure \(I_S\) and the HCI health measure \(I_H\), although a correlation of 0.74 is still high by any reasonable standard.
- Make a table with the means and standard deviations of all six sub-indices. What do high/low means imply in this context? What do high/low standard deviations imply in this context? What do we learn from this table?
summary_stat_table <- data.frame(
  mean=apply(sub_indices,2,mean),
  sd=apply(sub_indices,2,sd))

kable(summary_stat_table,digits=2)%>% kable_styling(full_width = F)| mean | sd | |
|---|---|---|
| I_L | 0.81 | 0.12 |
| I_E | 0.66 | 0.18 |
| I_I | 0.70 | 0.18 |
| I_V | 0.97 | 0.03 |
| I_S | 0.63 | 0.13 |
| I_H | 0.92 | 0.04 |
Recall that all of these indices can take on values from 0 to 1, with 0 meant to mean the complete lack of capacity and 1 meant to mean full capacity. Thus, the fact that the HCI survival sub-index \(I_V\) and health index \(I_H\) have means that are above 0.9 means that most countries are coming close to full capacity on these sub-indices. That is to say, given how the HCI has calibrated the consequences of childhood mortality and the two measures of health (adult survival and stunting), there are few countries that fall substantially short of full capacity on these sub-indices.
There is also little variation on these two sub-indices (low sd) compared to any of the other sub-indices. A low standard deviation here means that most countries have similar values, a high standard deviation means that countries vary widely.
Overall, we learn that two of the three sub-indices in HCI do not vary much across countries, which means that they will make little contribution to variation across countries in the overall index, as we will see below.
- Calculate the correlations of HDI with each of its three sub-indices. Calculate the correlation of HCI with each of its three sub-indices. One of the correlations will be notably high. In light of your response to 2, explain why you see this and what it means for understanding the quantity that is being measured by the relevant index.
## [1] 0.9199534## [1] 0.9621845## [1] 0.9628766## [1] 0.8533614## [1] 0.9906872## [1] 0.8219324The correlation between HCI and \(I_S\) is extremely high. The reason for this is not anything directly to do with \(I_S\), but rather the fact that there is so little variation in \(I_V\) and \(I_H\), the other two sub-indices of HCI. Since countries vary little in the survival and health sub-indices, almost all of the variation in HCI is due to variation in the schooling sub-index.
- Does your finding in Q3 mean that there is something wrong with the index? If you assume, for sake of argument, that the index is really capturing variation in the relevant concept well, what is implied about variation across countries in the relevant concept?
Just because HCI almost entirely determined by levels of schooling doesn’t mean it is failing to do what it aims to do. It is important that the authors made an effort to calibrate the effect of the sub-indices on human capital / productivity. If that calibration was successful, the fact that two of the sub-indices have little variation across countries reveals that the only substantial source of human capital / productivity variation across countries is variation in levels of schooling. In principle mortality and health matter, but HCI implies that in practice they have relatively little consequence in terms of productivity variation. If true (and one would need to carefully engage with the calibration of the coefficients that are discussed above), that is a useful substantive finding that emerges from the measurement project.
The implication of this for HDI is important, because HDI does not do this sort of calibration exercise. What if HDI is overweighting the importance of the non-education sub-indices, because of the relatively arbitrary way that it derived their weights through the choice of min and max values on the underlying indicators?
- Overall, do you find HDI or HCI a more convincing measure of the quantities that they are respectively trying to measure. There is no right answer here, just give it some thought!
One argument for HDI being a better measure include the fact that it seems to capture three more distinct aspects of development, whereas HCI is effectively just a schooling index for the reasons discussed above. While it is possible that the concept of human capital really just comes down to school and the concept of human development really is more expansive, it is also possible that HDI just had a more diverse set of measures and HCI is effectively a vary narrow measure, despite apparently using a similar number of underlying indicators.
One argument for HCI being a better measure is that it is based on a real attempt to calibrate the relative contributions to human capital / productivity of different indicators. While the authors could not follow the sort of supervised strategy that we considered previously, they have used the academic literature to justify particular weights/coefficients on indicators, as well as how they are aggregated. Thus the fact that the measure is effectively just a schooling measure is arguably a substantive conclusion, not a methodological shortcoming.
- As noted above, one way in which the two measures differ is that \(HDI^3 = I_{LE} \cdot I_E \cdot I_I\) whereas \(HCI = I_{V} \cdot I_{S} \cdot I_H\). Plot HDI and HCI against one another, then plot \(HDI^3\) against \(HCI\) (or plot \(HDI\) against \(HCI^{1/3}\)). Is one of these two measures generally “larger” than the other, when a fair comparison is made? Given the way they are designed, what does this imply about the extent to which countries are currently approaching the maximum possible level of “human development” and “human capital”?
# ggplot2
library(ggplot2)
library(ggthemes)
library(patchwork)

hcihdi$HDI3 <- hcihdi$HDI^3
hcihdi$HCI13 <- hcihdi$HCI^(1/3)

p1 <- ggplot(hcihdi, aes(x = HDI, y = HCI)) +
  geom_point() +
  geom_abline(intercept = 0, slope = 1) +
  scale_y_continuous("HCI",limits = c(0,1)) +
  scale_x_continuous("HDI",limits = c(0,1)) +
  theme_bw()

p2 <- ggplot(hcihdi, aes(x = HDI3, y = HCI)) +
  geom_point() +
  geom_abline(intercept = 0, slope = 1) +
  scale_y_continuous("HCI",limits = c(0,1)) +
  scale_x_continuous(expression(HDI^3),limits = c(0,1)) +
  theme_bw()

p3 <- ggplot(hcihdi, aes(x = HDI, y = HCI13)) +
  geom_point() +
  geom_abline(intercept = 0, slope = 1) +
  scale_y_continuous(expression(HCI^(1/3)),limits = c(0,1)) +
  scale_x_continuous("HDI",limits = c(0,1)) +
  theme_bw()

p1 + p2 + p3 + plot_layout(nrow = 1)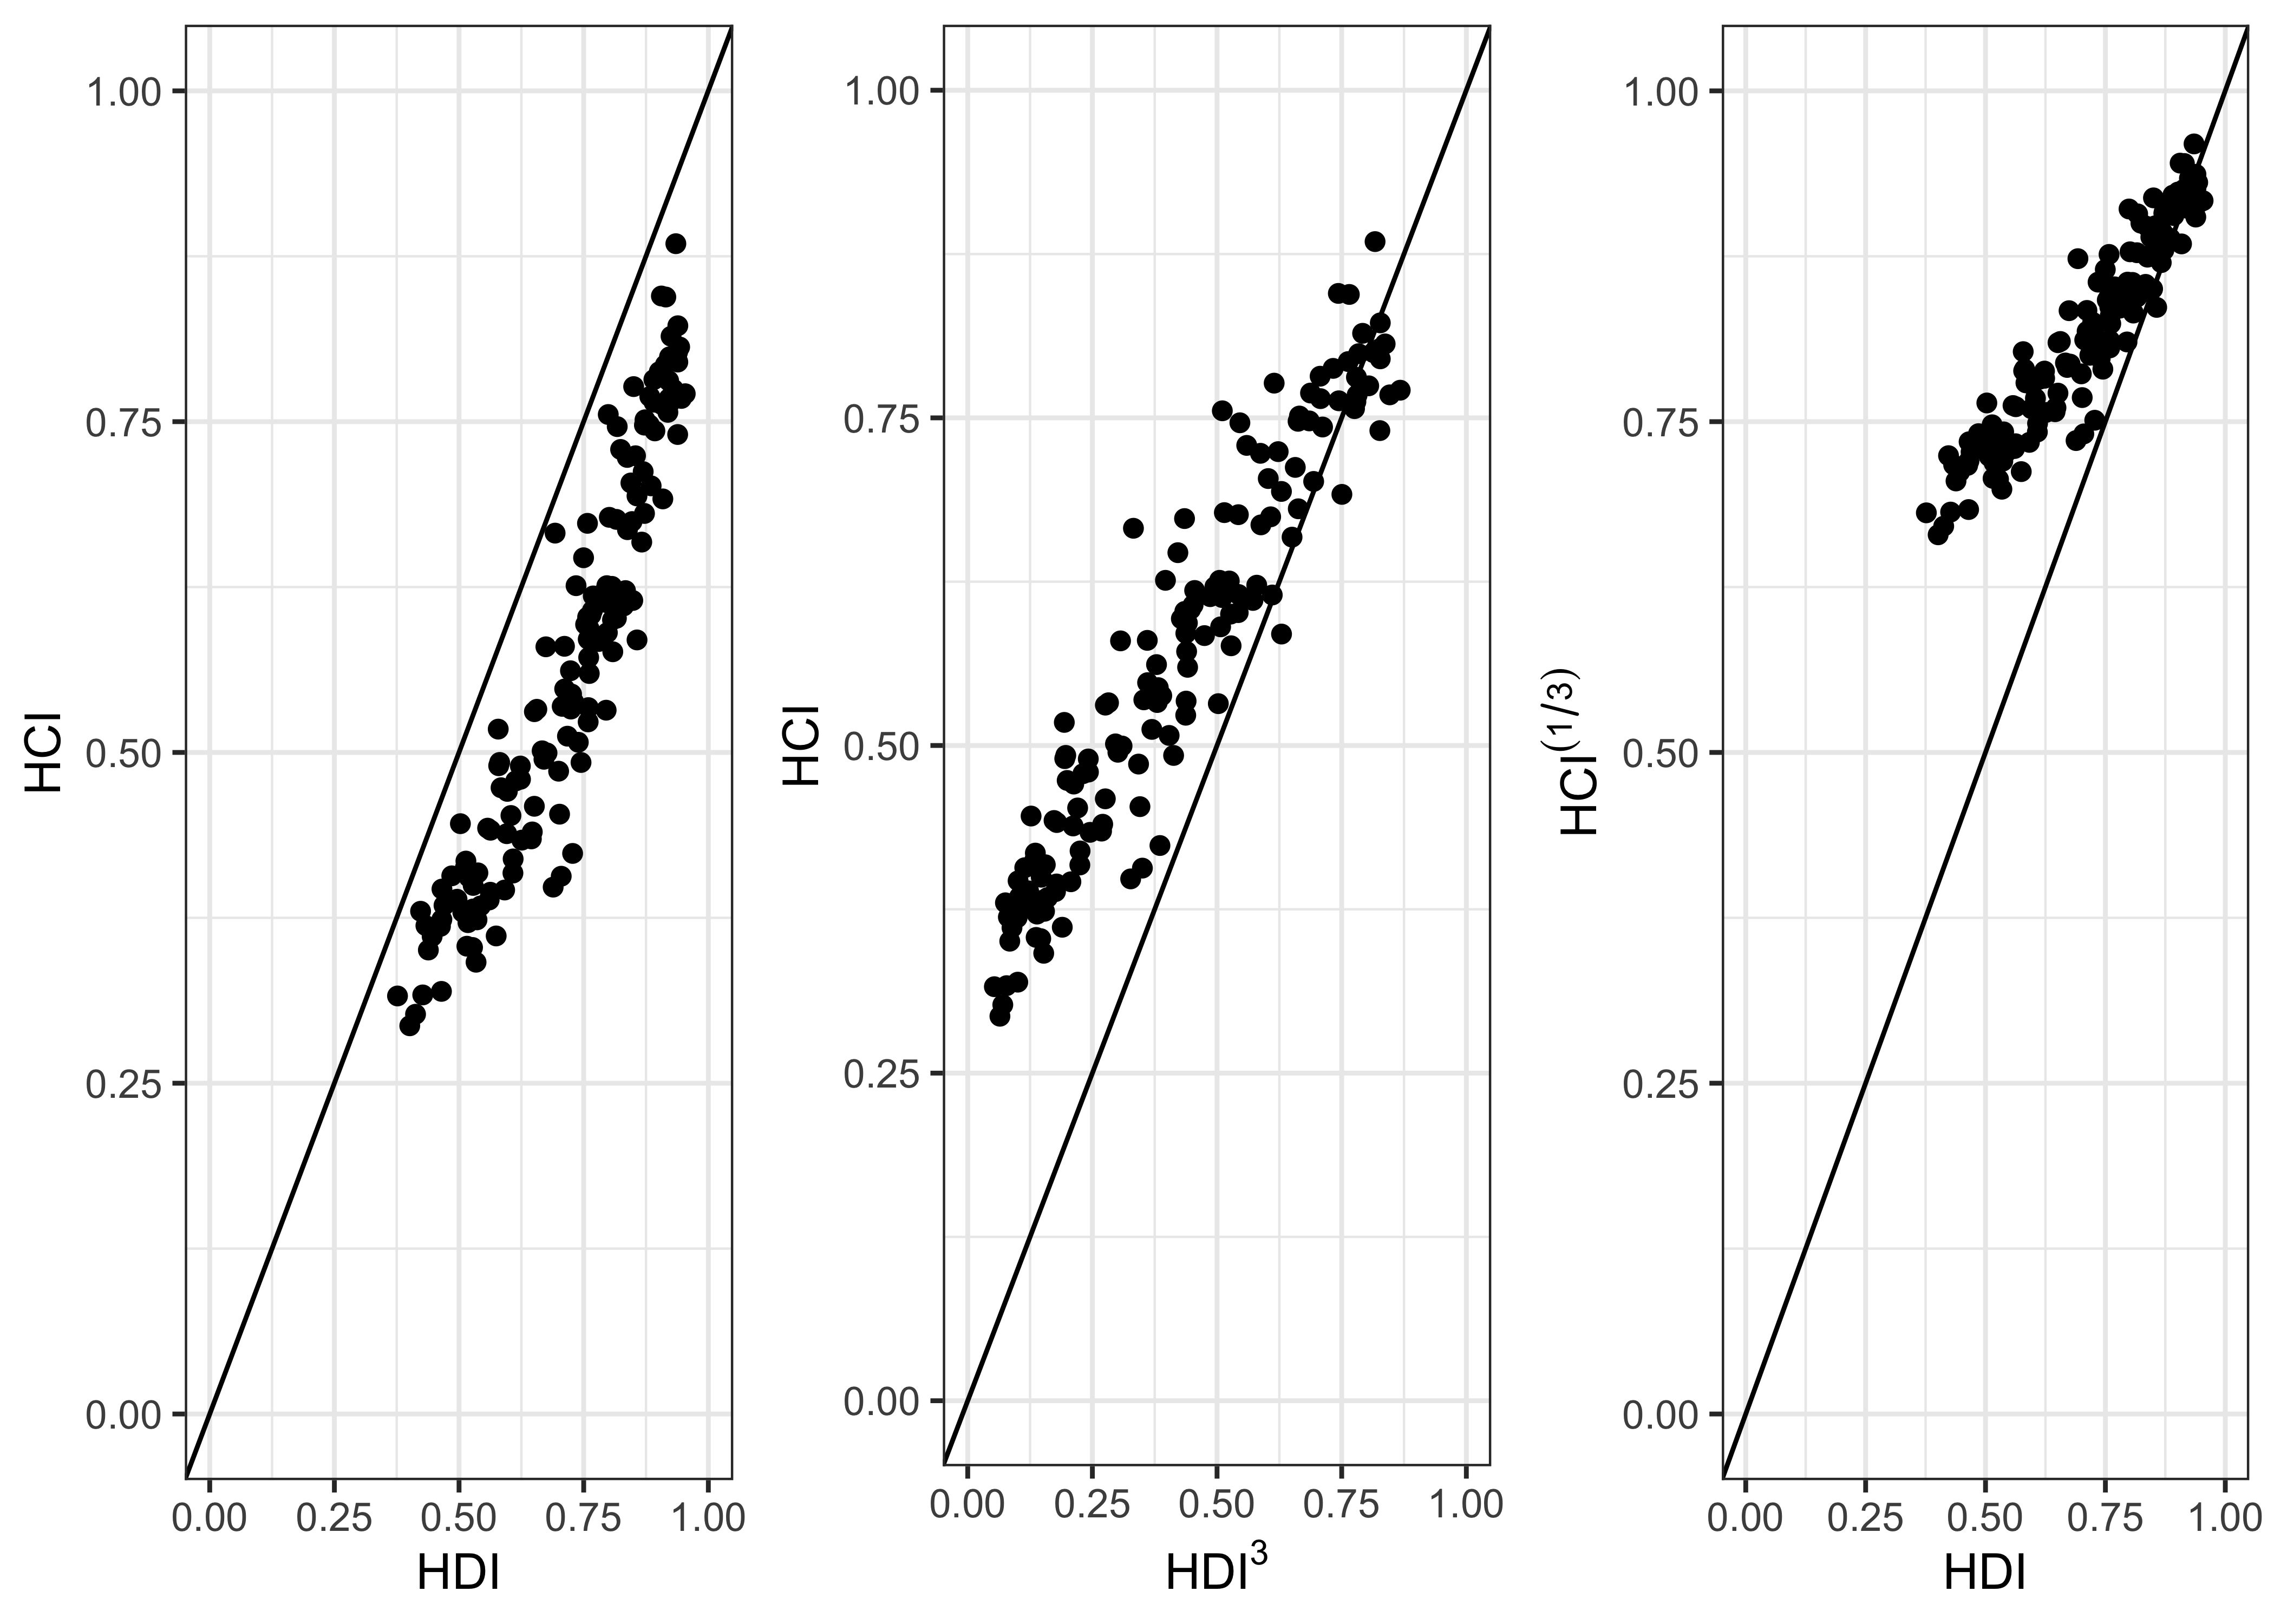
Generally the numerical values of HCI are larger than HDI, if they are placed on comparable scales, and especially so at low values of both the HCI and the HDI. This means that countries are currently better at approaching the maximum possible level of “human capital” than “human development”. This is primarily because most countries come very close to maximising the survival and health sub-indices of the HCI measure.
6.2 Quiz
- What is the intuition behind the construction of linear indices?
- It means learning about the relationship between indicators and the target concept by applying regression to training data with a pre-existing ‘gold standard’ measure.
- It means using theoretical/expert knowledge to construct a measure by combining relevant indicators in a deterministic way.
- It seeks to discover relevant underlying concepts by using covariation between observable indicators.
- It seeks to apply machine learning methods to learn which indicators are relevant and how much they contribute to the target concept.
- Which of the following is not correct?
- An index indicates that more or less of the target concept is present.
- An index is a composite statistic that is formed by aggregating multiple indicators.
- An index is something we have already measured or know how to measure and can use as a ‘gold standard’ measure.
- An index is often the result of an additive function of the indicators and sub-indices.
- What does the fact that additive indices are interval-level measures imply?
- Equally large differences in the index due to changes in different indicators must reflect equivalent differences in the underlying concept.
- It can convey ordering of units, but not the distance between them.
- It means that indices always have a meaningful zero point and there is a clear answer to what range the scale should cover.
- Equal increases or decreases at different points of the scale need not be equally meaningful.
- What steps does the general strategy of iterative decomposition of the target concept suggest?
- First, measure the indicators; second, identify how they relate to the target concept; third, add them up.
- First, decide on a weighting scheme; second, break the concept down into its constituent dimensions; third, measure the indicators in a way that fits the weighting scheme and add them back up.
- First, decide on what scale you want your index to be; second, decide on the number of indicators that should be in your measure; third, add them up and rescale them such that they fit your scale.
- First, identify the dimensions of your target concept and how they are interrelated; second, decide on and measure indicators that are relevant to these dimensions; third, combine the indicators according to how the dimensions are interrelated.
- When deciding which indicators to include, what considerations should guide you?
- You should take the definition seriously and find indicators that relate to each of its implied constituent dimensions.
- You should include those indicators that are highly correlated with each other.
- You should include the all the indicators that would have non-zero bivariate coefficients in a regression if you had a ‘gold standard measure’.
- You should always include the least possible indicators to minimise bias.