3 Deriving Scales from Theory
Topics: Using theoretical arguments to derive measures from indicator data. Axiomatic Analysis. Dimensional Analysis
Required reading:
- Chapter 6, Pragmatic Social Measurement
Further reading:
Applications
- Atkinson, Anthony. 1970. “On the Measurement of Inequality.” Journal of Economic Theory 2: 244–63
- Foster, James and Greer, Joel and Thorbecke, Erik “A class of decomposable poverty measures” Econometrica (1984): 761-766
- Laakso, Markku and Rein Taagepera. “Effective Number of Parties: A Measure with Application to West Europe” Comparative Political Studies (1979):3-27
- Rein Taagepera, Bernard Grofman. “Mapping the Indices of Seats–Votes Disproportionality and Inter-Election Volatility” Party Politics (2003)
Misc
- An introductory algebra level YouTube video Intro to Dimensional Analysis
3.1 Seminar
For this assignment, we are going to think about measures that relate the number of students to the number of teachers in the context of a university.
In the UK, these are commonly reported as “student-staff ratios” for the institution overall. In the US, statistics on this are variously reported, but sometimes focus on the average or other features of the distribution of course sizes. As of August 2019, Harvard’s FAQ on undergraduate education presented the following statement: “Some introductory courses as well as several other popular courses have large enrollments. Yet, the median class size at Harvard is 12. Of the nearly 1,300 courses offered last fall, for example, more than 1,000 of them enrolled 20 or fewer students.” Princeton advertises a “5:1 student to faculty ratio”. “The University of California - Berkeley advertises that 71% of undergraduate classes have fewer than 30 students.
You might reasonably suspect that there is a lot of selective choice of statistics to find ones that sound good. Clearly there are a range of measures that we could use. This assignment is going to lead you through thinking about which ones make the most sense from the perspective of a student trying to form expectations about how large their modules/courses will be. You have been provided with a dataset that includes the number of students enrolled in all of the POLS00XX undergraduate modules/courses taught by the UCL political science department in 2018-19. All full unit modules appear twice, once for each term, so all modules listed are half-unit.
- The student-staff ratio statistic is conventionally calculated as the ratio of the total number of students to the total number of staff. For the UCL political science department, there were 161 undergraduate students who were in the only political science department degree programme, the Philosophy, Politics and Economics BSc, in 2018-19 (in years 1, 2 and 3 combined), and there were 30 staff who taught on the courses in the data file. The student-staff ratio is therefore 161 students / 30 staff = 5.36. Why is this measure not very informative? Identify at least one potential problem with both the numerator and the denominator of the ratio. If you did this calculation at the level of a university, instead of a department, to what extent would that help?
The count of students is problematic because the UCL political science department is not a closed system. As you will know, because you are taking this course which has both political science and non-political science students enrolled, there are non-political science students taking POLS coded courses, and also political science students taking non-POLS coded courses. The former is not really a problem for our measure, since really they do make the POLS courses larger, but it could be that the political science students taking non-POLS coded courses experience larger or smaller course sizes when they take their required courses in ECON, for example.
The count of staff is a more serious problem because the staff are doing other things besides teaching undergraduates, to varying extents. They are teaching postgraduate courses. They are doing research. There is likely to be very little difference from a student perspective between the same member of staff teaching a single undergraduate course in each of the two teaching terms versus having two different members of staff teach those same courses, but the latter contributes twice as many staff as the former to the calculation.
Doing the calculation at the level of a university, rather than a programme, would address the problem of students taking courses across departments and could take into account all types of students, but would not help with staff having varying amounts of teaching as a proportion of their jobs. In principle, you might weight them by the proportion of their job that is meant to be devoted to teaching according the their contracts.
An illustration of these problem with student-staff ratio statistics is seen in an article on Times Higher Ed from 2016 Top 100 universities with the best student-to-staff ratio. If you look at the list of universities with the best (lowest) student-staff ratios, you will see a lot of US medical colleges/universities near the top. Medical education, particularly in the US, looks very “teacher-intensive” when assessed by student-staff ratios. There are two reasons for this. First, the students may not be entirely students: in the US medical students in their third and fourth years deliver medical care, supervised by the doctors who are teaching them. Second, the teaching staff are practicing doctors, who may be primarily delivering medical care while doing only a small amount of teaching. This means there are many doctors doing a little teaching rather than a few doctors doing a lot of teaching. Note the analogy to a research university where the staff are primarily doing research but teach a class or two, versus a more teaching oriented institution where teaching is nearly the entire job.
- Use the data file to compare UCL political science courses to the statistics advertised above. What is the median class size? What proportion of classes enrolled 20 or fewer students? What proportion of classes enrolled 30 or fewer students?
## [1] 41## [1] 0.1538462## [1] 0.2564103The median class size is 41, 15% of classes have 20 or fewer students and 26% of classes have 30 or fewer students.
- Compare the mean and median class sizes for UCL political science courses. Why might universities tend to prefer to report the median class size to the mean class size? Is one of these obviously more relevant from the student perspective?
## [1] 42.10256The mean class size is 42 versus a median of 41. In this case, there is not much difference in the mean and median, because the distribution of course size is only a little right skewed:
library(ggplot2)
library(ggthemes)
ggplot(pols_data, aes(x=students)) +
  geom_histogram(bins = 10, fill= "lightgray", colour = "black") +
  theme_clean() +
  theme(plot.background = element_rect(color= NA))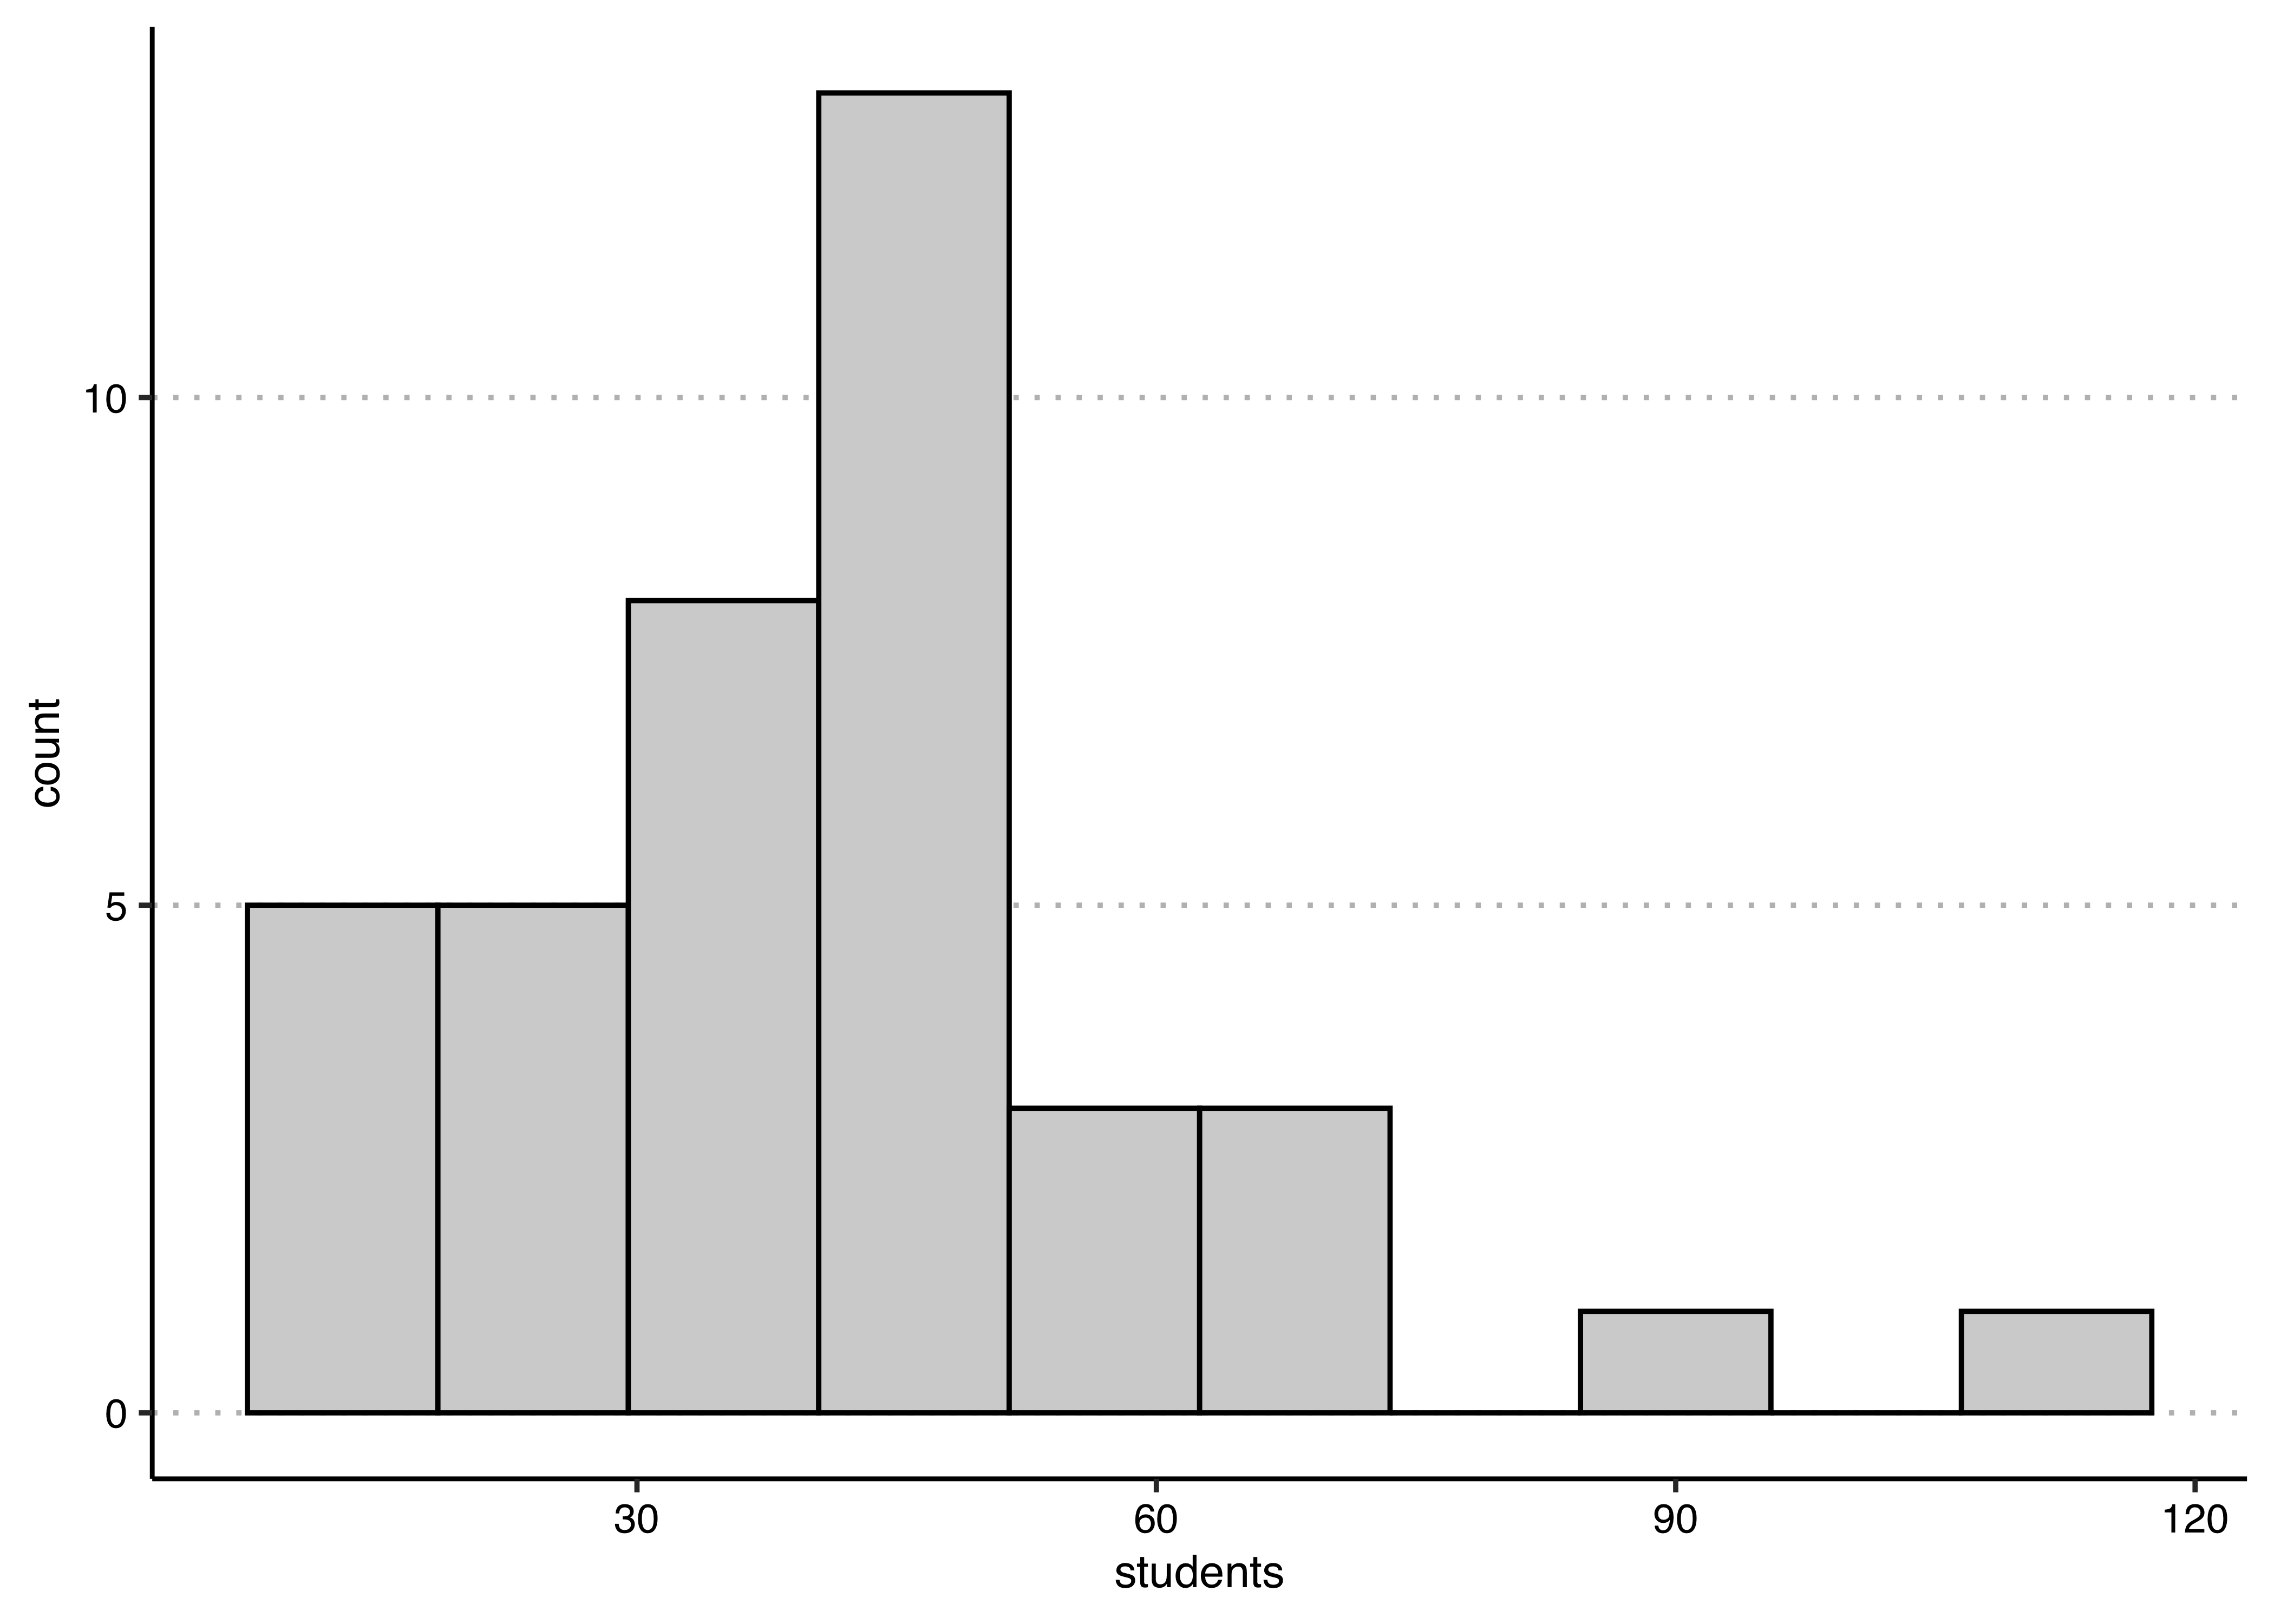
The reason why universities often want to report medians rather than means is that they have many small courses and a few very large courses, in which case the median will be substantially lower the mean.
- We are now going to think about what statistic is most relevant at capturing the student experience. To constrain the problem a bit, let’s think in terms of some kind of average/mean. Where \(m\) is the number of classes taught, and \(\textrm{s}_j\) is the size / number of students of class \(j\), the mean class size statistic is: \[ A_1 = \frac{\sum_{j=1}^m \textrm{s}_j}{m} \] Come up with a “toy example” that illustrates why this could be a very bad representation of students’ experience of class size. Make your example as simple as possible to illustrate the problem and explain what the problem is.
The simplest possible example is of the following form. Imagine each student is taking one course. Imagine there are only two courses, one with a larger number of students and one with a small number of students, for example 100 students and 2 students. The average course size is then \(\frac{100 + 2}{2} = 51\). This is in fact the average size of the two courses, but it gives a very poor summary of the student experience. This is not so much because there are no courses near the mean, but rather that nearly every student experiences a 100 person course, which is much larger than 51. You can make a more extreme version of this by imagining 10 courses, with 100, 2, 1, 1, 1, 1, 1, 1, 1 and 1 students each. These courses have an average size of 11, but over 90% of the students are in a 100 person course.
## [1] 51## [1] 11
- I propose that the following is a better measure of the concept that we are attempting to measure, the average class size from the perspective of a student: \[ A_2 = \frac{\sum_{j=1}^m \textrm{s}_j^2}{\sum_{j=1}^m \textrm{s}_j} \] What is the value of this measure for your toy example? Does this seem like a better representation of the average experience of students in that example?
We can calculate this alternative statistic as follows:
## [1] 98.07843## [1] 91.01818The values of 98 for the 100,2 example and 91 for the 100, 2, 1, 1, 1, 1, 1, 1, 1, 1 example are much closer to the experience of the typical student, which in both cases is being in a 100 person course.
- State some axioms that you would want a measure to satisfy. Does the measure that I have proposed satisfy those axioms?
Axioms 1, 2, 3 and 5 from the lecture are applicable here, with slight modification. I just restate 1, 2 and 3 here.
Axiom 1: If all the courses have the same number of students \(s\), the measure should equal that number.
Proof: If \(s_j = s\) \(\forall\) \(j\), then
\[\begin{eqnarray*} A_2 &=& \frac{\sum_{j=1}^m \textrm{s}^2}{\sum_{j=1}^m \textrm{s}} \\ &=& \frac{m \cdot \textrm{s}^2}{m \cdot \textrm{s}} \\ &=& s \end{eqnarray*}\]
Axiom 2: If all courses except one have no students, then the measure should be the size of that course.
Proof: If \(s_1 = s\) and \(s_1 = 0\) \(\forall\) \(j \ne 1\), then
\[\begin{eqnarray*} A_2 &=& \frac{\sum_{j=1}^m \textrm{s}^2}{\sum_{j=1}^m \textrm{s}} \\ &=& \frac{\textrm{s}^2+0+0+\cdots}{\textrm{s}+0+0+\cdots} \\ &=& \frac{\textrm{s}^2}{\textrm{s}} \\ &=& s \end{eqnarray*}\]
Axiom 3: Adding courses with zero students should not change the measure.
Proof: See proof for Axiom 2. Note that the average course size \(A_1\) fails to meet both of these axioms because adding a course that no one takes increases the number of courses.
- What are the units of the measure that I have proposed?
\[\left\{ A_2 \right\} = \frac{\{\textrm{students}\}^2}{\{\textrm{students}\}} = \{\textrm{students}\}\]
The units are \(\{\textrm{students}\}\), which is good since we want to measure a typical class size from the perspective of the students.
- Why does this measure work better? Hint: try thinking about a simple example like one class with two students and one class with six students.
In essence, whereas \(A_1\) is a course-weighted average, \(A_2\) is a student-weighted average. How can we see that this is the case? It helps to start with a very simple example: one course with 2 students and one course with 6 students. With these two courses, \(A_1 = 4\) while \(A_2 = 5\). Let’s look closely at the mathematical calculation of \(A_2\):
\[\begin{eqnarray*} A_2 &=& \frac{\sum_{j=1}^m \textrm{s}^2}{\sum_{j=1}^m \textrm{s}} \\ &=& \frac{2^2+6^2}{2+6} \\ &=& \frac{2+2+6+6+6+6+6+6}{8} \end{eqnarray*}\]
There are eight students. Two of the students experience a class size of 2 students. Six of the students experience a class size of 6 students. The average of those eight student experiences is what you get by calculating \(A_2\). There are more students in the big class than the small class, so a lot more students are experiencing the larger classes than the smaller classes. This is what we saw in the toy examples earlier as well.
Note that the average course size \(A_1\) is a perfectly reasonable representation of the experience of the teachers. If you want to advertise small class sizes to potential staff you are looking to hire, \(A_1\) is probably a better statistic. However, if you want to advertise small class sizes to potential students, you should probably use the student-weighted average \(A_2\).
- What is the value of this measure for the UCL political science department data set? How does it compare to the median and mean number of students per class?
## [1] 51.9659## [1] 42.10256This student-weighted average measure is 52 for the UCL data, versus 42 and 41 for the mean and median, respectively. This is somewhat higher, suggesting that the average experience of students in UCL political science courses is a course of 52 students, even though the average course has 42. Again, the key difference is averaging the experience of the students versus averaging the courses.
- What is the value of this measure for Harvard? Is this value surprising given the advertised class sizes quoted above? How can these things all be true?
The UCL political science department has a relatively symmetric and narrow distribution relative to what is seen at other institutions. By contrast to UK universities, US universities sometimes have severely skewed distributions of class size because students take more courses outside the topic of their degree. Harvard may advertise that 70% of courses have 20 or fewer students, but the largest courses at Harvard are very, very large. The course enrollment statistics that Harvard posts every term reveal enormous courses. The largest ten undergraduate course enrollments at Harvard in 2018-19 were:
| Title | Students |
|---|---|
| Intro to Computer Science | 763 |
| The Ancient Greek Hero | 662 |
| Principles of Economics (Term 1) | 580 |
| Introduction to Probability | 511 |
| Principles of Economics (Term 2) | 460 |
| Classical Chinese Ethical and Political Thought | 453 |
| Intro to Life Sciences II | 434 |
| Abnormal Psychology | 416 |
| Big Data | 357 |
| Intro to Life Sciences I | 351 |
One thing to note (and a good reminder to always check what’s in your data!), is that some courses don’t have any undergraduate students in them. Therefore, in order to make a ‘fair’ comparison, we need to remove those courses in which there are no undergraduate students. Otherwise, the denominator for the mean student number per module will be higher than it should be, as it will include all Graduate students-only modules.
## [1] 18.68388## [1] 114.8445These courses are so large that they are being taken by very large fractions of the student body, which is 1650 undergraduates per year. Nearly half of Harvard undergraduates are taking the introductory computer science course, about a third are taking each of The Ancient Greek Hero, Principles of Economics, and Introduction to Probability, and about a quarter are taking each of the remaining courses on this list. This means that despite all those small courses, most Harvard undergraduates are also taking several very large courses, and so the average student experience is not just small courses. The average number of undergrads in courses at Harvard in 2018-19 was 19 but the student-weighted average \(A_2\) was 115.
Of course one could argue that we should be looking at a student-weighted median instead of a student-weighted mean, but the more subtle point is that we are running up against the limits of a single measure for describing student experience. Particularly when distributions have a high level of variation, you probably need to think about more than just one statistic to effectively summarize them. This is why measures of dispersion like the standard deviations exist. Whereas saying that a UCL undergrad will experience courses that average 52 students gives a pretty good summary of the student experience because most courses are close to that, a typical Harvard undergrad will experience a mix of courses that are much larger and much smaller than that.
3.2 Quiz
- When deriving scales from theory…
- We estimate the relationship between the indicator data and the concept of interest from the data.
- The concept we have in mind does not need to be mathematically consistent.
- Dimensional and axiomatic analyses are general strategies that help us derive measures that make sense.
- The method used to aggregate from data to concept is always the same, regardless of context.
- Why does the equation of the COVID alert level, as seen in the Prime Ministers tweet, not make sense?
- Because it is multiplying a rate (0,1) and a count number (0,+Inf)
- Because it is adding a rate (0,1) and a count number (0,+Inf)
- Because it does not take into account the case-fatality rate.
- Because it fails the axiom of equal cases.
- Which of the following is not true according to the rules of dimensional analysis?
- You can multiply and divide numbers with different units.
- You cannot add, subtract and compare numbers with different units.
- You can convert number a with unit \(\{a\}\) to unit \(\{b\}\) by multiplying a with any number with unit \(\frac{\{b\}}{\{a\}}\).
- You cannot perform unit conversion on compound units.
- What is the purpose of axiomatic analysis?
- The generation of a measure based on rules (axioms), that specify certain properties we may want our measure to have
- To derive measures from patterns observed in the data.
- The analysis of the dimensions and units of measurement of different quantities and, if necessary, convert them to a common scale based on which additions/comparisons can be made.
- To make our measure as objective as possible.