4 Supervised Scale Measurement I: Comparison Data
Topics: Scoring competition data. Rating transfer systems. Bradley-Terry models. Interpretation of latent variable models.
Required reading:
- Chapter 7, Pragmatic Social Measurement
Further reading:
Bradley-Terry Models
- “How do I interpret the coefficients in an ordinal logistic regression in R?”
- “Ordinal Logistic Regression in R Data Analysis Examples”
- Heather Turner and David Firth. “Bradley-Terry Models in R: The BradleyTerry2 Package”
Applications - Political Science
- Peter John Loewen, Daniel Rubenson and Arthur Spirling. “Testing the power of arguments in referendums: A Bradley–Terry approach” Electoral Studies. Volume 31, Issue 1, March 2012, Pages 212-221
- Zucco Jr, Cesar and Batista, Mariana and Power, Timothy J. “Measuring portfolio salience using the Bradley–Terry model: An illustration with data from Brazil” Research & Politics 2019 6:1.
Applications - Health/Medicine
Applications - Geography
4.1 Seminar
For this assignment, we are going to replicate some of the analysis in the paper “Measuring portfolio salience using the Bradley–Terry model: An illustration with data from Brazil” by Zucco Jr, Batista, and Power (2019). The authors of that paper conducted surveys of serving Brazilian legislators as well as academic experts (political scientists in Brazil), in order to assess which cabinet positions were more highly valued. Respondents were given random pairs of ministries, and “were asked to choose the ministry they thought a typical politician would prefer to obtain for his or her party.”
The original data are available on Dataverse. We will be working with a cleaned-up versions of the legislator and expert survey data sets, which can all be be downloaded above.
While we discussed in lecture that it is possible to estimate these models using a logistic regression with a certain specification of the covariate data, we will use a package that sets up the data appropriately and provides useful summaries more easily. You will need to install and load the BradleyTerry2 R library.
- Use the function
BTm()to fit the Bradley-Terry model on the comparisons made by legislators using the code below. Then use theBTabilities()function to examine the estimates for the relative appeal of different ministries. You might wish to sort the output usingorder()to make it easier to see which ministries have the highest and lowest Bradley-Terry estimates.
BTm_fit <- BTm(
  cbind(Win_1,Win_2), # the outcome
  player1 = Ministry_1, player2 = Ministry_2, # the players
data = legislator_data) # the data## ability s.e.
## Urban Affairs (Cidades) 0.7576435 1.498461
## Planning 0.5258038 1.104852
## Finance (Fazenda) 0.1894528 1.264487
## Presidential Chief of Staff (Casa Civil) 0.0000000 0.000000
## Education -0.9657022 1.088956
## Mines & Energy -1.0817730 1.109065
## Health -1.4108754 1.123494
## Science & Technology -1.9135528 1.137293
## National Integration (Regional Development) -1.9169621 1.066929
## Agriculture -1.9391308 1.114952
## Labour -2.1351504 1.221408
## Foreign Affairs -2.1556289 1.114311
## Justice -2.2219849 1.084030
## Social Security & Pensions -2.4042219 1.133850
## Industry & Foreign Trade -2.5642038 1.174198
## Communications -2.5853053 1.171376
## Small Business Administration -2.6671633 1.645113
## Social Development -2.7058362 1.382053
## Institutional Relations (Legislative Affairs) -2.7588553 1.172379
## Sec Gen of Presidency (Civil Society) -2.9177365 1.258813
## Defence -3.1167094 1.179601
## Strategic Affairs -3.2274157 1.317725
## Environment -3.5811617 1.189741
## Transportation -3.6106625 1.237303
## Comptroller General -3.7473088 1.555362
## Port Authority -3.7950900 1.269551
## Agrarian Reform -3.9420395 1.225873
## Tourism -4.3352748 1.232645
## Human Rights -4.3708261 1.400968
## Culture -4.6830538 1.206549
## Sports -4.8588105 1.310547
## Social Communication -5.1499148 1.303384
## Fisheries -5.1796216 1.413980
## Advancement of Women -5.2902278 1.356694
## National Security Advisor -5.5313877 1.307834
## Civil Aviation Authority -5.6423025 1.275926
## Advancement of Racial Equality -5.6700707 1.389069We can see that the ministries that are most appealing to legislators are Urban Affairs, Planning, Finance, the Casa Civil, Education, Mines & Energy and Health. It is notable that some ministries that might seem prestigious (eg Foreign Affairs, Justice, Defense) are ranked lower that these.
- Use the code below to merge the Bradley-Terry estimates with the ministry data. Then run a linear regression analysis predicting the Bradley-Terry “ability” (coefficients) using
log(Budget)andlog(Appointees). Interpret the results of this regression. What might it tell us about which kinds of ministries are more appealing to Brazilian legislators?
merged_data <- merge(ministry_data,
                     BTabilities(BTm_fit),
by.x="Ministry_English",by.y= "row.names")##
## Call:
## lm(formula = ability ~ log(Budget) + log(Appointees), data = merged_data)
##
## Residuals:
## Min 1Q Median 3Q Max
## -2.6472 -0.9549 -0.0381 0.7602 4.4865
##
## Coefficients:
## Estimate Std. Error t value Pr(>|t|)
## (Intercept) -6.95027 1.93675 -3.589 0.00103 **
## log(Budget) -0.07711 0.12518 -0.616 0.54202
## log(Appointees) 0.96875 0.32280 3.001 0.00501 **
## ---
## Signif. codes: 0 '***' 0.001 '**' 0.01 '*' 0.05 '.' 0.1 ' ' 1
##
## Residual standard error: 1.523 on 34 degrees of freedom
## Multiple R-squared: 0.2857, Adjusted R-squared: 0.2437
## F-statistic: 6.799 on 2 and 34 DF, p-value: 0.003282When we run a linear regression analysis predicting the Bradley-Terry “ability” (coefficients) using log(Budget) and log(Appointees), we find that the number of appointees controlled by the minister predicts the Bradley-Terry estimates of the ministries’ relative appeal, but the budget does not. This helps make sense of some of the more surprising ministries listed among the most appealing (eg Planning).
This regression is not all that predictive, with an \(R^2\) of 0.29. Nonetheless, you might argue that the fact that the number of appointees controlled by the minister explains even this much variation is notable.
- Repeat the same series of analyses from Q1 and Q2, but using the expert survey data
expert_datainstead of the legislator survey datalegislator_data. What is the same and what is different about the estimates?
# fit BT model
BTm_fit2 <- BTm(cbind(Win_1,Win_2),
                player1=Ministry_1,player2=Ministry_2,
                data=expert_data)

# extract estimates and SE
ability_est2 <- BTabilities(BTm_fit2)
ability_est2[order(ability_est2[,1],decreasing=TRUE),]
## ability s.e.
## Finance (Fazenda) 0.02714945 0.2275751
## Health 0.01502715 0.2114789
## Presidential Chief of Staff (Casa Civil) 0.00000000 0.0000000
## Planning -0.19334316 0.2294534
## Education -0.34682077 0.2176724
## Mines & Energy -0.35501096 0.2125888
## Urban Affairs (Cidades) -0.42646280 0.2627426
## Transportation -0.65956724 0.2177195
## Industry & Foreign Trade -0.69650123 0.2711808
## Sec Gen of Presidency (Civil Society) -0.80288865 0.2596030
## Agriculture -0.97059399 0.2111616
## Justice -1.06737342 0.2254604
## National Integration (Regional Development) -1.07856230 0.2120868
## Social Security & Pensions -1.34001123 0.2318308
## Institutional Relations (Legislative Affairs) -1.37113799 0.2468705
## Labour -1.43228697 0.2242190
## Social Development -1.46096596 0.2538897
## Communications -1.53222612 0.2215235
## Agrarian Reform -1.75455366 0.2847317
## Science & Technology -2.13800971 0.2603678
## Strategic Affairs -2.18665727 0.3243826
## Comptroller General -2.23560489 0.3232378
## Foreign Affairs -2.30476086 0.2402957
## Port Authority -2.34957355 0.2719920
## Environment -2.42942775 0.2827211
## Defence -2.47594191 0.2588590
## Social Communication -2.49104313 0.3259083
## Sports -2.54649671 0.2791943
## Tourism -2.80922361 0.2876568
## Culture -3.00112721 0.2860768
## Small Business Administration -3.02761335 0.3297308
## Fisheries -3.06797676 0.2839643
## Civil Aviation Authority -3.24107534 0.2891461
## Human Rights -3.41146117 0.3314709
## National Security Advisor -3.42811908 0.3297984
## Advancement of Women -4.03106681 0.3435526
## Advancement of Racial Equality -4.25098610 0.3510828# combine with data with ministry specific data
merged_data2 <- merge(ministry_data,
BTabilities(BTm_fit2),
by.x="Ministry_English",by.y= "row.names")
# run regression to see what alphas are associated with
lm_fit2 <- lm(ability ~ log(Budget) + log(Appointees), data = merged_data2)
summary(lm_fit2)##
## Call:
## lm(formula = ability ~ log(Budget) + log(Appointees), data = merged_data2)
##
## Residuals:
## Min 1Q Median 3Q Max
## -1.91958 -0.71278 -0.04338 0.76649 2.03521
##
## Coefficients:
## Estimate Std. Error t value Pr(>|t|)
## (Intercept) -4.94341 1.21743 -4.061 0.000272 ***
## log(Budget) -0.06730 0.07869 -0.855 0.398380
## log(Appointees) 0.78285 0.20291 3.858 0.000485 ***
## ---
## Signif. codes: 0 '***' 0.001 '**' 0.01 '*' 0.05 '.' 0.1 ' ' 1
##
## Residual standard error: 0.9572 on 34 degrees of freedom
## Multiple R-squared: 0.3927, Adjusted R-squared: 0.357
## F-statistic: 10.99 on 2 and 34 DF, p-value: 0.0002079We see very similar ministries near the top of the rankings, and the same qualitative regression result that appointees matter (holding budget constant) and budgets do not (holding constant appointees).
- Plot the Bradley-Terry estimates based on the expert survey data against those based on the legislator survey data. Use a square plot, the same range for x and y on the plot, and overlay the line with intercept 0 and slope 1 so that you can see any numerical differences between the estimates clearly. Also calculate the correlation coefficient between the two sets of estimates.
## [1] 0.8576482library(ggplot2)
library(ggthemes)
plotdata <- data.frame("legislators"=merged_data$ability,
"experts"= merged_data2$ability,
"ministry"= merged_data$Ministry_English)
ggplot(plotdata,aes(x=legislators, y=experts)) +
geom_point() +
geom_abline(intercept = 0,slope = 1,color="red") +
ylim(-6,1) +xlim(-6,1) +
labs(x="Legislator Survey Estimates",y="Expert Survey Estimates") +
theme_clean() +
theme(plot.background = element_rect(color=NA))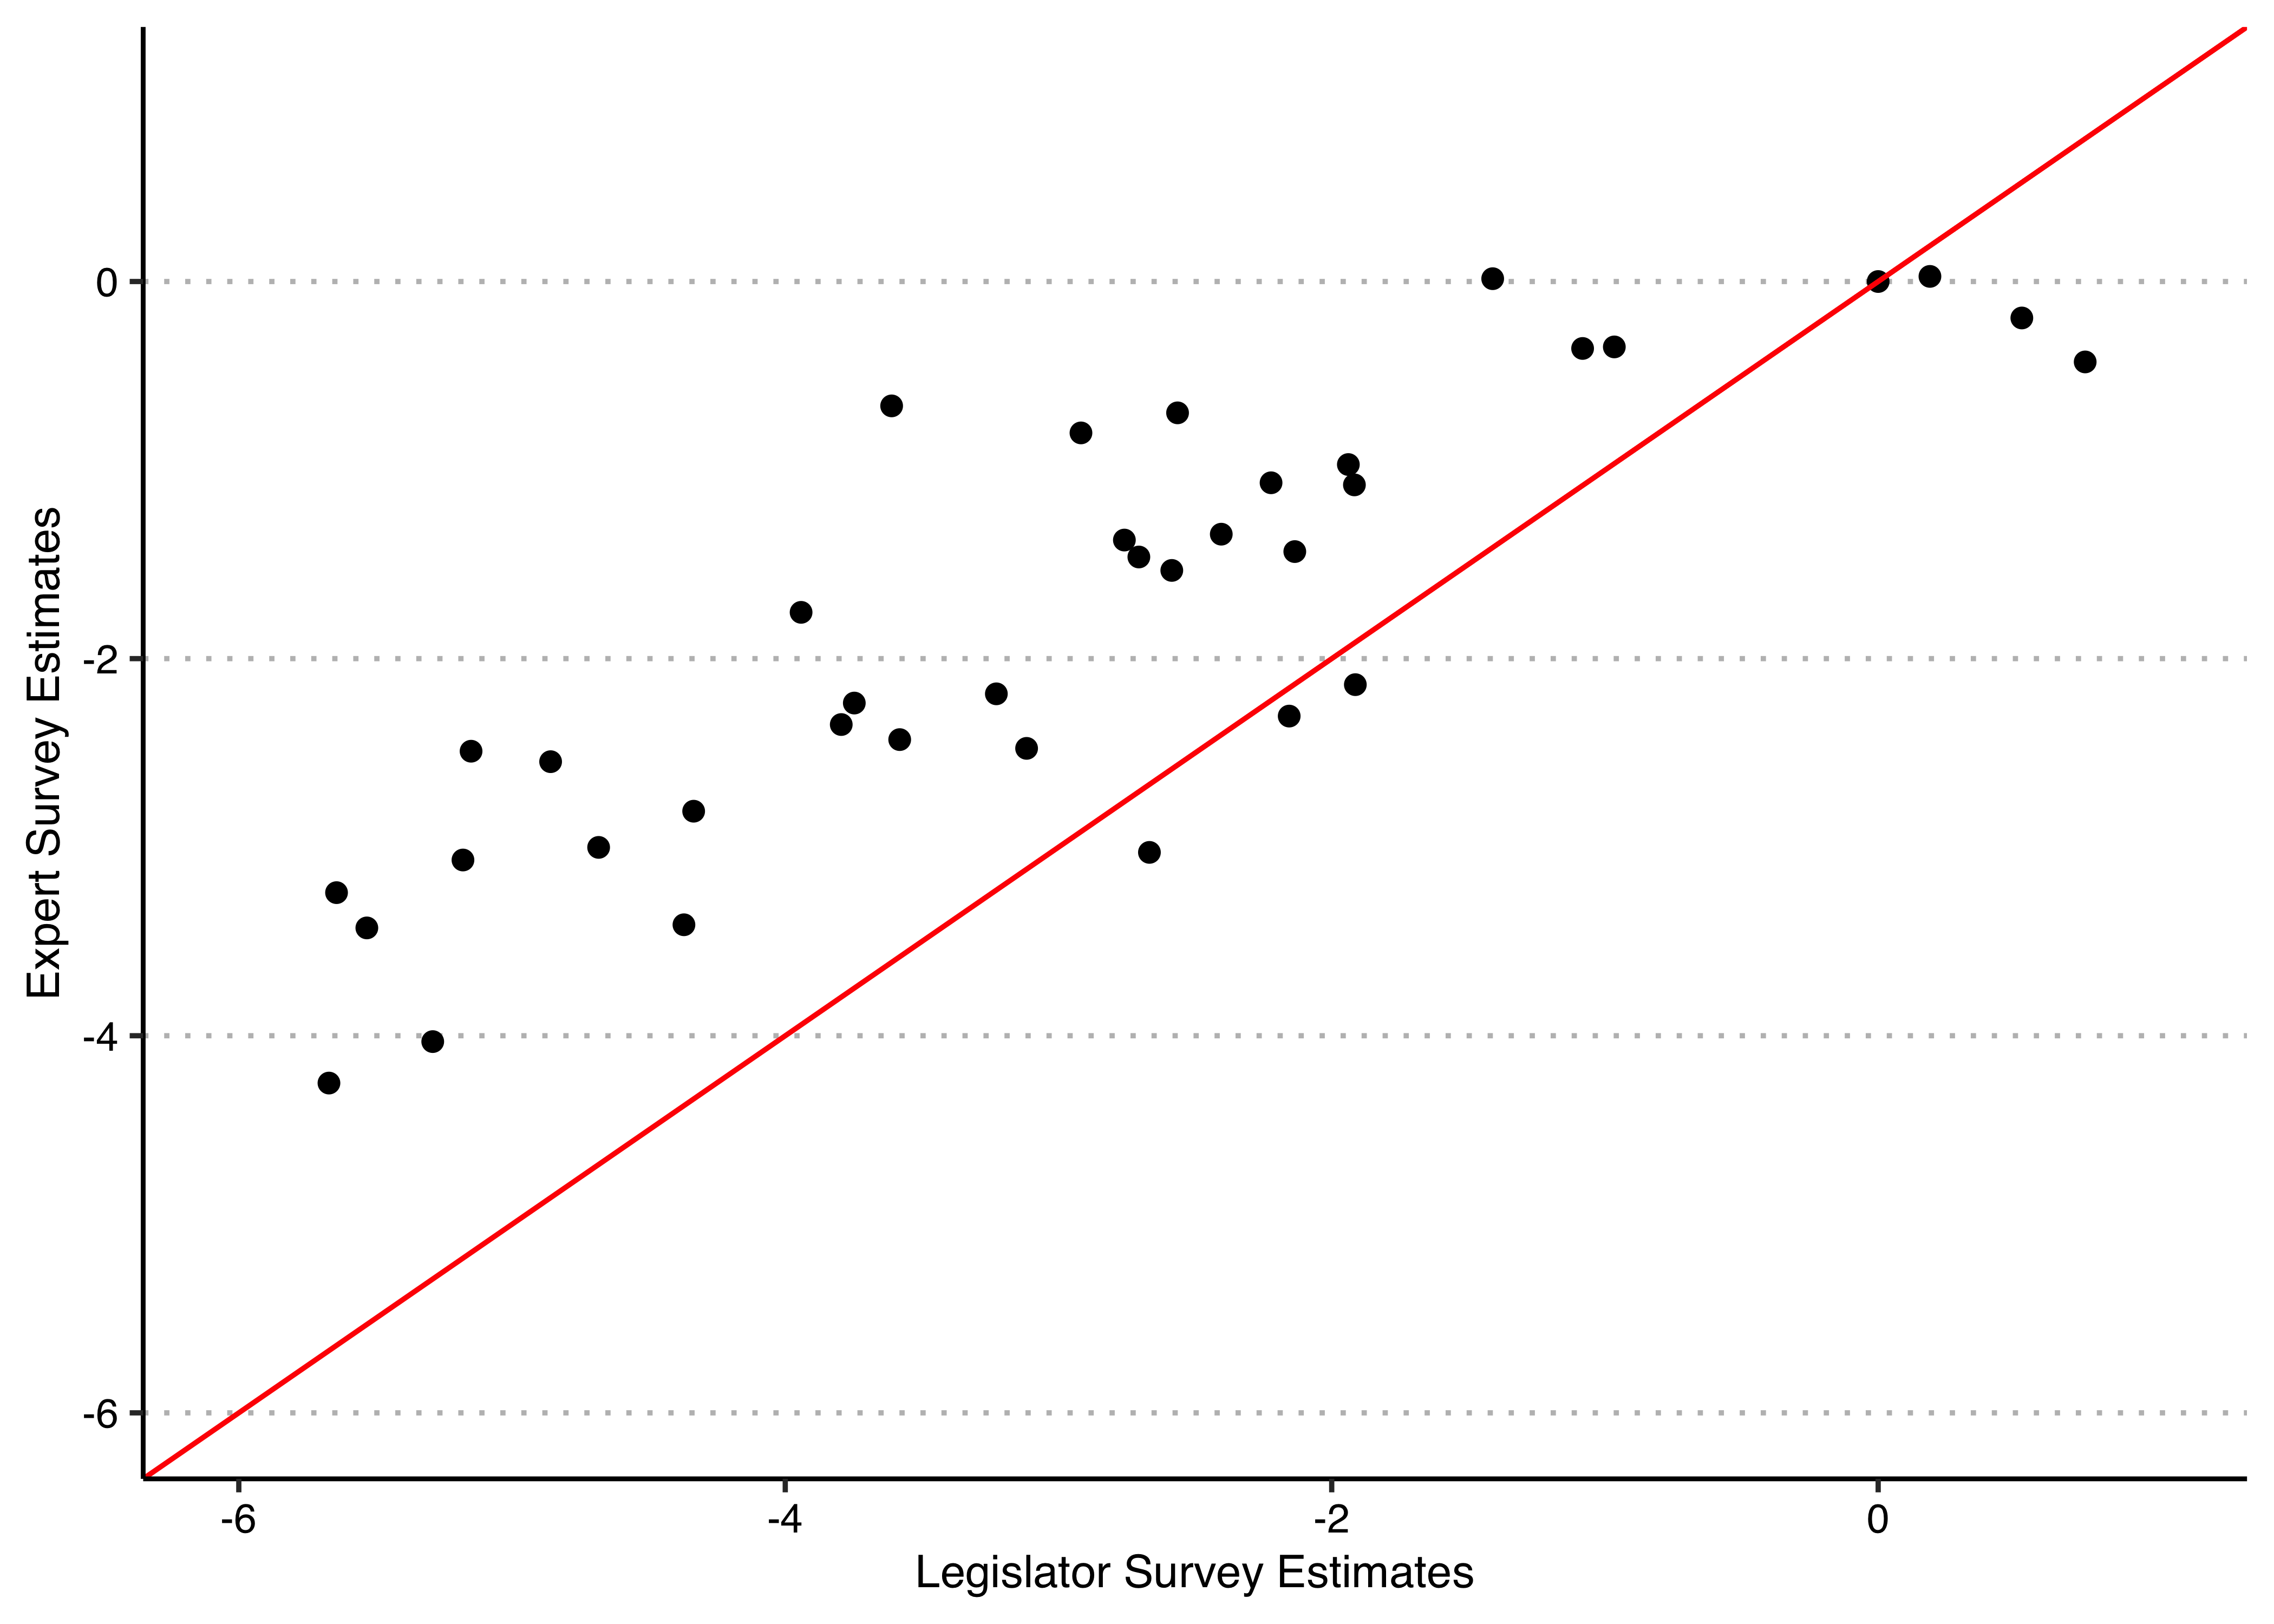
The legislator survey estimates are a bit more spread out, ranging from -5.5 to 0.5, versus the expert survey estimates which vary from about -4 to 0. If you wanted to highlight in the plot those ministries which have the largest discrepancy in the ranking order between legislators and experts, here’s how you could go about it (again, this is completely optional, only if you enjoy plotting stuff!):
# create a variable which is TRUE when the absolute value of the difference
# in the rank of each variable is larger or equal to 10
plotdata$diff <- (abs(rank(plotdata$legislators) - rank(plotdata$experts))) >=10

ggplot(plotdata,aes(x=legislators, y=experts)) +
  geom_point(aes(col = diff)) +
  geom_abline(intercept = 0,slope = 1,color="red") +
  geom_text(data=plotdata[plotdata$diff,],
            aes(x=legislators, y=experts, label = ministry),
            hjust = 0, nudge_x = .1, size = 3) +
  ylim(-6,1) +xlim(-6,1) +
  labs(x="Legislator Survey Estimates",y="Expert Survey Estimates") +
  scale_color_manual(values=c("gray","black")) +
  theme_clean() +
  theme(plot.background = element_rect(color=NA),
        legend.position = "none")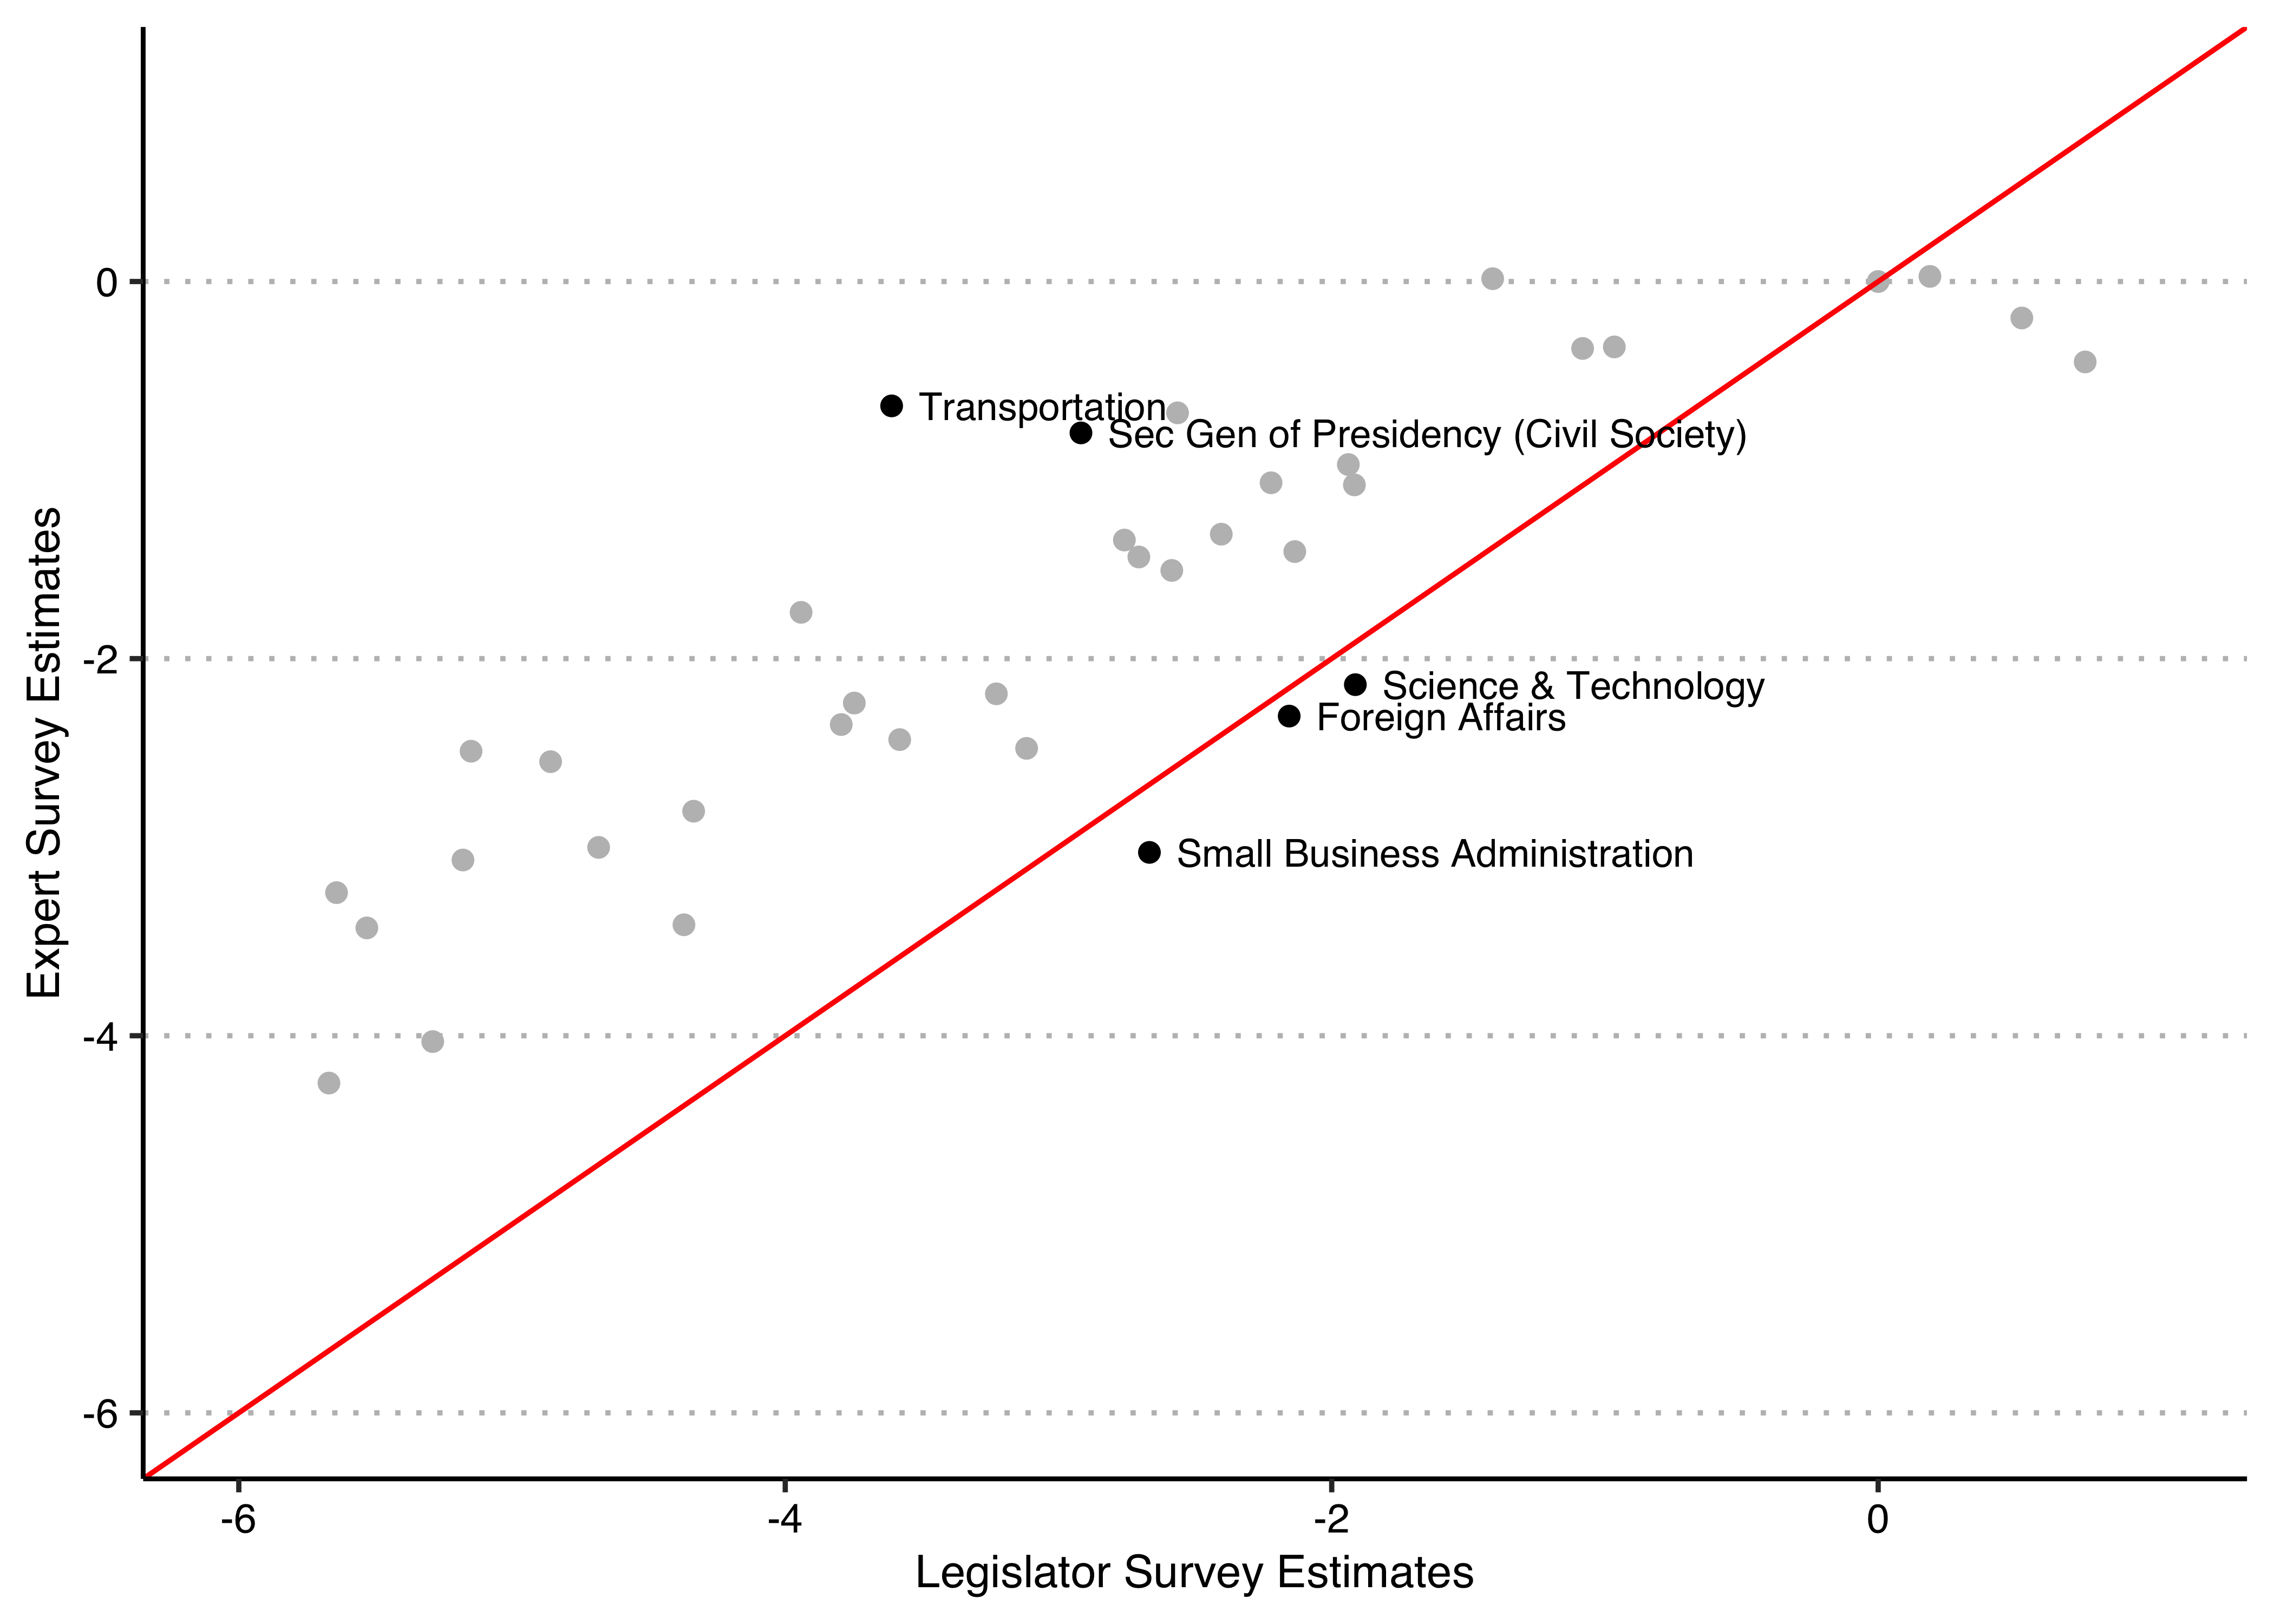
- Calculate the proportion of comparisons that we would expect the most appealing ministry to win against the least appealing ministry given the estimates from the legislator survey and also given the estimates from the expert survey (these will not be the same ministries in both cases, the point here is to get a sense of how big the range of estimates is). Code Hint: If you are solving this “by hand”, it is useful to know that if \(\log \left(\frac{p}{1-p} \right) = x\) then \(p = \frac{exp(x)}{1 + exp(x)}\). Alternatively, you can work it out by having R calculate the relevant predicted probabilities / fitted values using
predict().
We can see already from Q4 that the legislators were a bit more decisive/consistent in applying the same relative rankings than the experts were. We can calculate the predicted probabilities of the strongest ministry defeating the weakest in various ways. Here is the “manual” way to do the calculation:
# legislator survey data
minmax_diff <- diff(range(merged_data$ability)) # get diff between min and max
exp(minmax_diff)/(1+exp(minmax_diff)) # calculate predicted probability
## [1] 0.9983865# expert survey data
minmax_diff <- diff(range(merged_data2$ability)) # get diff between min and max
exp(minmax_diff)/(1+exp(minmax_diff)) # calculate predicted probability## [1] 0.9863212It is actually a bit tricky to predict on new data with BTm models. The key step is to define factor variables that have the same factor levels as the original ones, which you can do with factor() by specifying the option levels = as shown below. You can extract the name of the ministry that has the maximum/minimum ability estimate by combining row.names() and which.max()/which.min(), the latter of whom give you which row number the maximum/minimum have.
# legislator survey data
predict(BTm_fit, type="response",
        newdata = data.frame(
          Ministry_1 = factor(row.names(ability_est)[which.max(ability_est[,1])],
                              levels = levels(legislator_data$Ministry_1)),
          Ministry_2 = factor(row.names(ability_est)[which.min(ability_est[,1])],
                              levels = levels(legislator_data$Ministry_2))))
## 1
## 0.9983865# expert survey data
predict(BTm_fit2, type="response",
newdata = data.frame(
Ministry_1 = factor(row.names(ability_est2)[which.max(ability_est2[,1])],
levels = levels(expert_data$Ministry_1)),
Ministry_2 = factor(row.names(ability_est2)[which.min(ability_est2[,1])],
levels = levels(expert_data$Ministry_2))))## 1
## 0.9863212These are both very decisive, essentially everyone agrees on the “easy” comparisons of the most versus least appealing ministries, whether you are surveying the legislators or the experts.
- Do you find the comparisons in Q3, Q4 and Q5 reassuring or concerning regarding the conclusions that you had in Q2? What is the same and what is different about the estimates from the two different surveys?
These comparisons are largely reassuring regarding the validity of the measures. There is some evidence that the legislators provide a more consistent/decisive collection of comparison data. But we seem to get very similar results in terms of which are highly ranked and lowly ranked ministries, and also in terms of the regression analysis examining which types of ministries are appealing.
- Come up with at least one novel application of a Bradley-Terry model to measure some concept that interests you. This should take the form of quantifying some body of common knowledge among some set of individuals with relevant expertise. What is the prompt? What is the concept you are trying to measure? What is the relevant population of experts?
For example, one could survey students completing their Q-step degree with randomly generated pairwise comparisons of their 6 Q-step modules. The prompt might be: “Which of these two modules did you think was a better module?”. The concept that you would then be measuring is which modules Q-step students thought were better/worse. The population of experts would be Q-step students who have completed all six modules.
4.2 Quiz
- Under which conditions are the number of wins of \(j\) a good measure of their underlying `ability’ \(\alpha_j\)?
- The schedule should be unbalanced.
- Every player does not need to face opponents with the same distribution of strengths.
- There are no conditions under which the number of wins is a good measure of ability.
- Each player should play the same number of matches.
- What is the problem with sumo wrestling tournaments?
- It is sensitive to grade inflation over time as new entrants introduce more points to be redistributed.
- Not everyone has the same number of matches.
- Not everyone fights against everyone.
- Wrestlers only fight other wrestlers close to their initial rank.
- They do not count draws.
- What does \(\alpha_j – \alpha_{j'}\) in a Bradley-Terry model measure?
- The log odds that \(j\) defeats \(j'\).
- The odds that \(j\) defeats \(j'\).
- The log odds that \(j'\) defeats \(j\).
- The probability that \(j\) defeats \(j'\).
- The home side advantage of \(j\).
- Which of the following is not true about a Bradley Terry model?
- The mean absolute levels of the alpha parameters are arbitrary, there is no meaningful zero for this scale.
- It cannot easily be extended to an ordinal BT model to deal with draws.
- When \(\alpha_j = \alpha_{j'}\), \(j\) and \(j'\) are equally likely to win.
- It is a special case of logistic regression models.
- What are the units of the Bradley terry estimates?
- Wins of \(j\) over \(j'\).
- The points given to the players by a trusted third party.
- The log odds ratio of better results vs worse results.
- Bradley Terry estimates are unitless.